FIGURE 3.
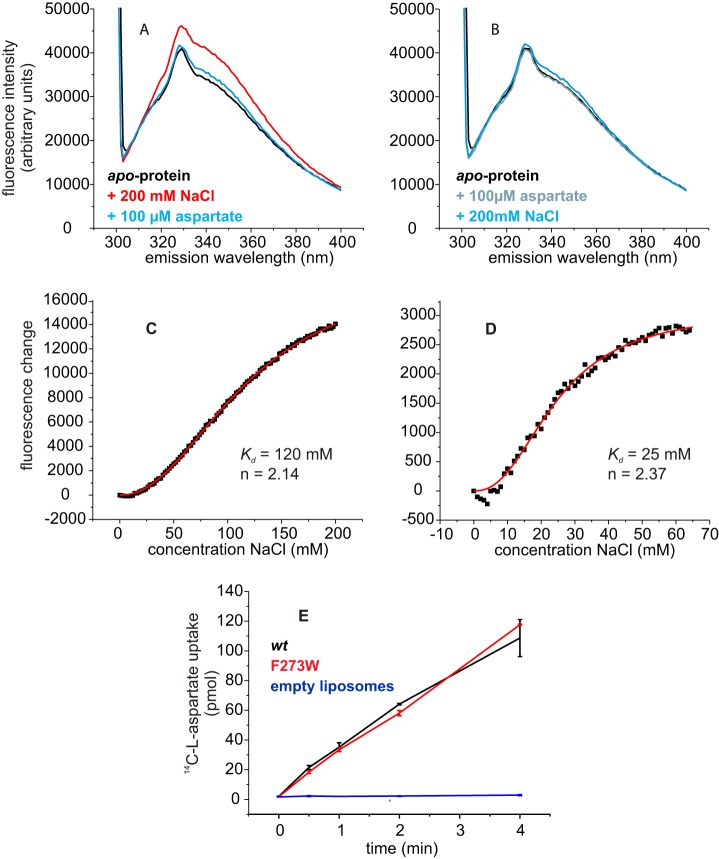
Tryptophan fluorescence and transport activity of GltPh variant F273W. A, fluorescence emission spectra of the apoprotein (black) after the addition of 200 mm NaCl (red) and after subsequent addition of 100 μm aspartate (blue). In panel B the order of additions was reversed: fluorescence emission spectra of the apoprotein (black) after the addition of 100 μm Asp (gray) and after the subsequent addition of 200 mm NaCl (blue). In panels C and D the fluorescence changes as a function of Na+ concentration are shown in the absence of aspartate and in the presence of 100 μm aspartate, respectively. The dots represent the average fluorescence levels corrected for dilution measured at the indicated NaCl concentrations. The red lines are best fits to the Hill equation. E, l-[14C]aspartate uptake of GltPh variant F273W (red) and wild-type GltPh (black) in proteoliposomes and in control liposomes without protein (blue).

