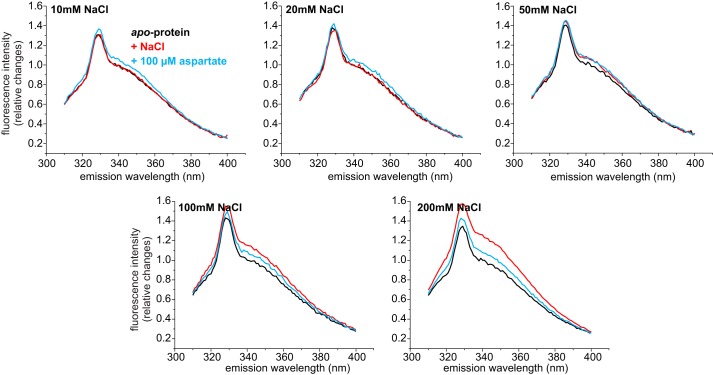
FIGURE 4.
Tryptophan fluorescence spectra of GltPh variant F273W in the presence of different NaCl concentrations. Fluorescence emission spectra of the apoprotein (black) after the addition of NaCl (red, concentration as indicated) and after subsequent addition of 100 μm aspartate (blue). For better comparison the spectra were normalized taking the fluorescence of the apoprotein at 343 nm as 1.

