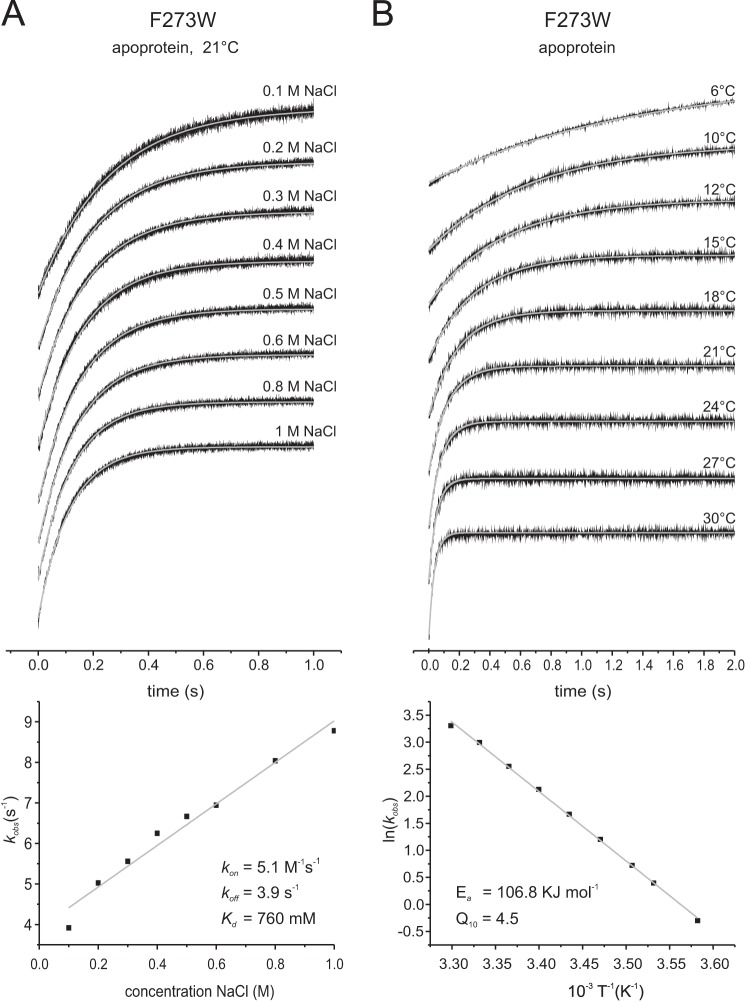
FIGURE 6.
Rates of Na+ binding to GltPh F273W. The top panels show the stopped-flow fluorescence measurements. Each trace (black) represents an average of 6–15 individual traces, fitted with a single exponential equation (gray). A, 1.5 μm F273W apoprotein was mixed with solutions of the indicated concentrations of NaCl; KCl was present so that the sum of the NaCl and KCl concentrations was 1 m. All measurements were performed at room temperature. The bottom panel shows the kobs values plotted against the corresponding NaCl concentrations. The slope of the linear fit gives the kon, and the intercept with the kobs axis gives the koff value. B, 1.5 μm F273W was mixed with 1 m NaCl at different temperatures as indicated, and the bottom panel shows the Arrhenius plot of the derived kobs. The gray line is a linear fit of the data according to the Arrhenius equation ln(k) = B + (ln(Ea)/RT), with Ea representing the activation energy, B representing the frequency factor, T representing the absolute temperature, and R representing the gas constant. The linear fit results in an Ea = 106.8 kJ mol−1.

