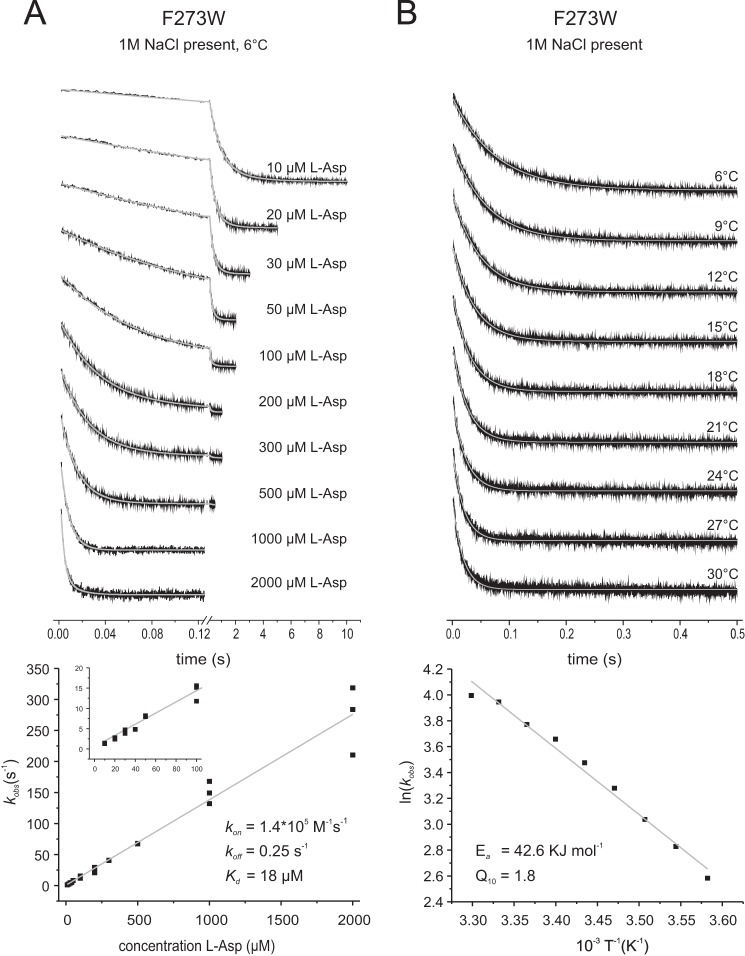
FIGURE 8.
Rates of l-aspartate binding to GltPh F273W in the presence of 1 m NaCl. The top panels show the stopped-flow fluorescence measurements. Each trace (black) represents an average of 6–10 individual traces. A, 1.5 μm F273W was mixed with varying l-Asp concentrations as indicated, and individual traces were fitted with a double exponential equation (gray). In the bottom panel the kobs values resulting from the fits with assumed pseudo-first-order reaction are plotted against the corresponding aspartate concentrations. The slope of the linear fit gives the kon, and the intercept with the kobs axis gives the koff value. The inset shows the data at low aspartate concentrations. B, 1.5 μm F273W was mixed with 100 μm l-asp at different temperatures as indicated, and individual traces were fitted with a single exponential equation. The bottom panel shows the Arrhenius plot of the derived kobs. The gray line demonstrates the linear fit of the data according to the Arrhenius equation ln(k) = B + (ln(Ea)/RT), with Ea representing the activation energy, B representing the frequency factor, T representing the absolute temperature, and R representing the gas constant. The linear fit results in an Ea = 42.6 kJ mol−1.

