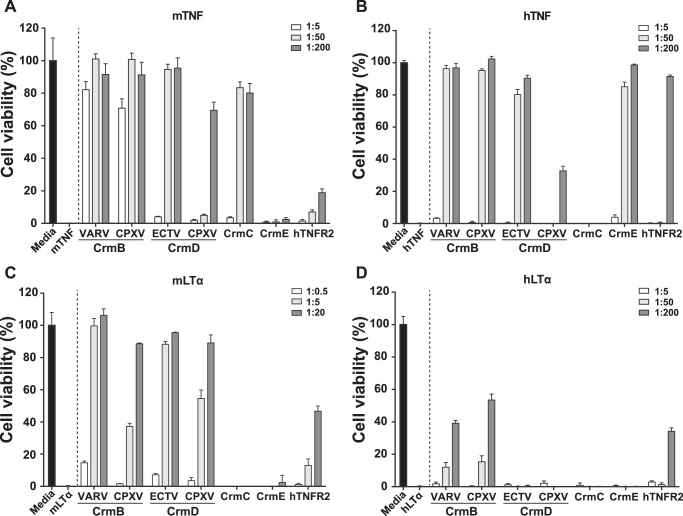
FIGURE 3.
TNF and LTα inhibitory activity of vTNFRs and hTNFR2. Inhibition of the cytotoxicity induced by mTNF (A), hTNF (B), mLTα (C), and hLTα (D) in L929 cells in the presence of purified recombinant vTNFRs or hTNFR2 at the indicated cytokine:protein molar ratios. Cell viability was assessed as the absorbance at 492 nm using the Cell Titer Aqueous One Solution kit (Promega). Values were normalized with the absorbance recorded from samples containing only the corresponding cytokine, and these were set to zero. Data are represented as the percentage relative to the absorbance in the absence of cytokine (media). Means ± S.D. of triplicate samples of three representative experiments are shown.

