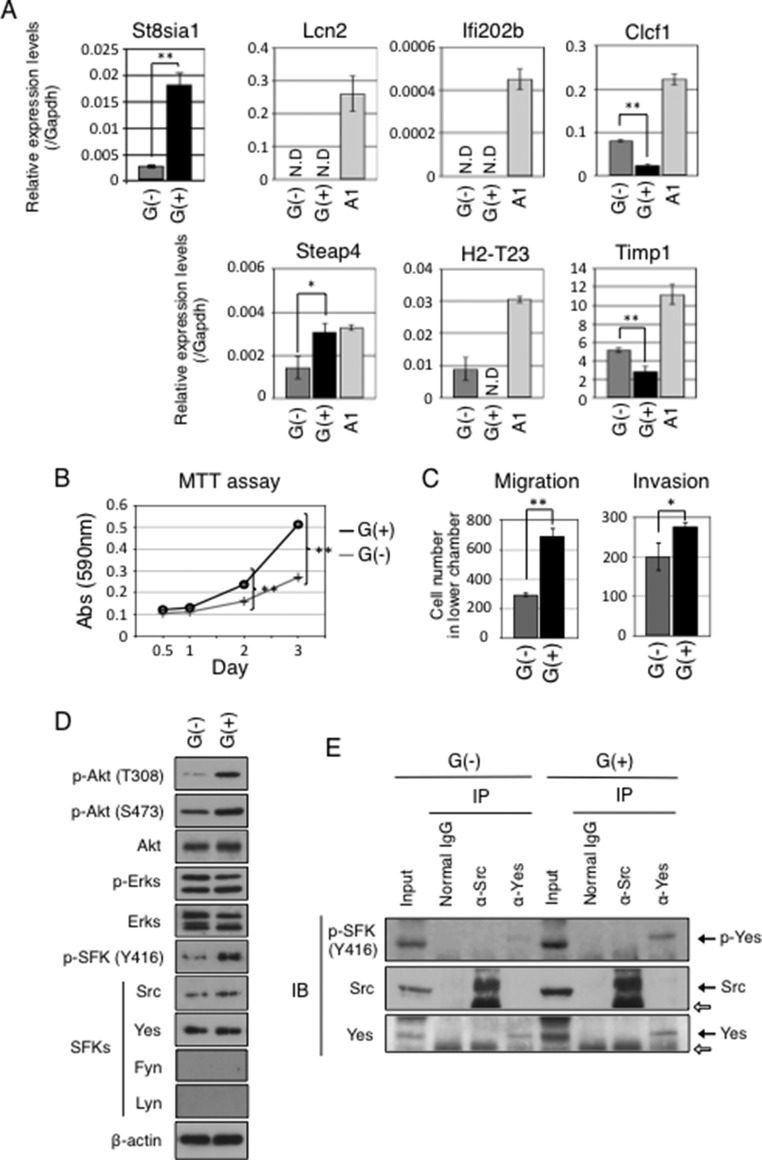
FIGURE 3.
GD3-positive cells showed distinct gene expression patterns from those of reactive astrocytes and enhanced malignant properties with increased phosphorylation levels of Akt and Yes kinases compared with GD3-negative cells. A, mRNA expression levels of St8sia1, Lcn2, Ifi202b, Clcf1, Steap4, H2-T23, and Timp1 in G(−) and G(+) cells were examined by quantitative RT-PCR. Expression levels were normalized with Gapdh data. mRNA expressions in LPS-stimulated A1 cells (100 ng/ml) were also analyzed. N.D., not detected. *, p < 0.05; **, p < 0.01. B, cell growth in G(+) and G(−) cells measured by MTT assay. Cells (1 × 10³) were plated in 96-well plates in DMEM supplemented with 10% FCS at day 0, then cell growth was measured at days 0.5, 1, 2, and 3. The black line indicates G(+) cells, and the gray line indicates G(−) cells. **, p < 0.01. C, migration and invasion activities in G(+) and G(−) cells measured using cell culture inserts. Two × 104 cells were plated in the upper chamber in serum-free medium. The lower chamber contained DMEM supplemented with 10% FCS. After incubation for 24 h, invaded cells to the reverse side of membrane were counted after Giemsa staining. When invasion activities were measured, chambers were pre-coated with MatrigelTM (50 μg) as described under “Experimental Procedures.” Black bars indicate G(+) cells, and gray bars indicate G(−) cells. *, p < 0.05; **, p < 0.01. D, phosphorylation levels of Akt, ERKs, and SFKs in G(+) cells and G(−) cells were examined by Western blotting. Used antibodies were indicated at the left side of the bands. E, results of immunoprecipitation (IP)-immunoblotting (IB) experiments. Immunoprecipitates prepared from the lysates of G(−) and G(+) cells (4 × 10⁵) with an anti-Src or an anti-Yes antibody were analyzed by Western blotting. The white arrows indicate IgG heavy chains.

