FIGURE 5.
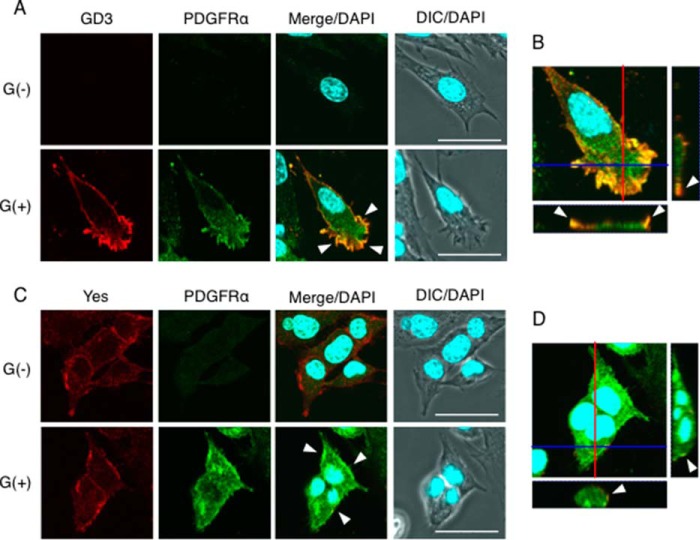
PDGFRα was co-localized with GD3 and Yes kinase in GD3-positive astrocytes. A, immunocytochemical staining of G(−) cells and G(+) cells with an anti-GD3 mAb and an anti-PDGFRα antibody. After incubation with an Alexa 568-conjugated anti-mouse IgG antibody and an Alexa 488-conjugated anti-rabbit IgG antibody for secondary antibodies, cells were stained with DAPI to visualize nuclei and observed under a confocal microscopy. The red color indicates GD3, and green indicates PDGFRα. Arrowheads indicate co-localization of GD3 and PDGFRα at the leading edge of cells (yellow). B, the z-stack image of G(+) cells as in A. The image of the y-z axis in a red line is presented on the right side of the panel, and the x-z axis is presented in a blue line on the bottom side of the panel. C, immunocytochemical staining of G(−) cells and G(+) cells with an anti-Yes antibody and an anti-PDGFRα antibody as described in A. Before staining, cells were incubated with DMEM containing 10% FCS for 30 min as described in Fig. 3E. Arrowheads indicate co-localization of Yes and PDGFRα (yellow). D, the z-stack image of G(+) cells as in C. The y-z axis image (red line) is presented on the right side. The x-z axis image (blue line) is presented on the bottom side. Scale bars, 40 μm. DIC, differential interference contrast.

