FIGURE 5.
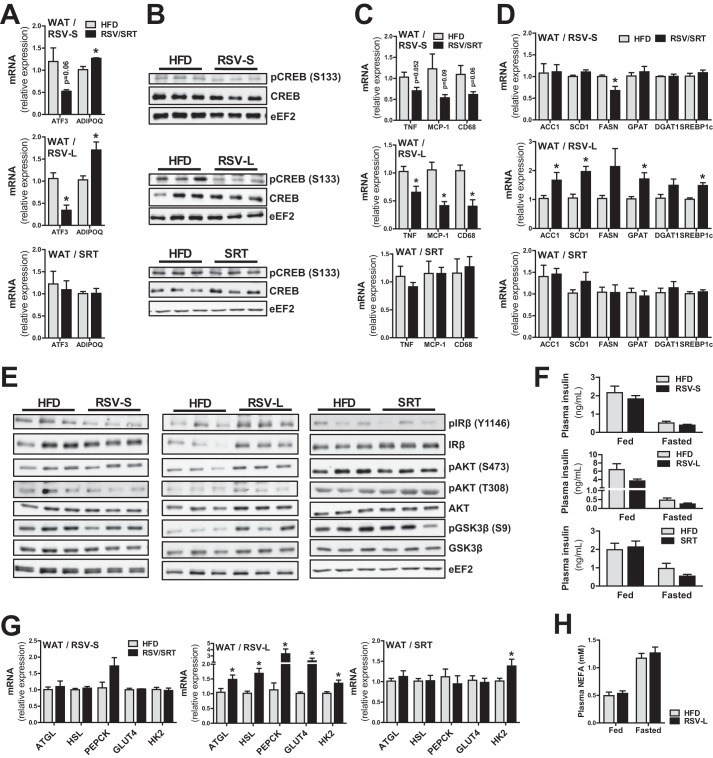
RSV treatment affects lipid metabolism in white adipose tissue. A, mRNA levels of Atf3 and Adipoq in WAT, relative to Polr2a (RSV-S and RSV-L) or Hprt (SRT) (n = 5–8/group). B, representative immunoblots of CREB total protein and CREB phosphorylation (Ser-133) in WAT (n = 6/group). C and D, mRNA levels of genes associated with inflammation (C) and lipogenesis (D) in WAT, relative to Polr2a (RSV-S and RSV-L) or Hprt (SRT) (n = 5–8/group). E, representative immunoblots of IRβ, Akt, and GSK3β as well as their respective phosphorylations in WAT (n = 6/group). F, insulin levels in plasma from ad libitum-fed and 16-h-fasted mice (n = 5–8/group). G, mRNA levels of genes involved in lipolysis and glycerol 3-phosphate generation in WAT, relative to Polr2a (RSV-S and RSV-L) or Hprt (SRT) (n = 5–8/group). H, non-esterified fatty acid levels in plasma from ad libitum-fed and 16-h-fasted mice (n = 5–8/group). Bars, means ± S.E. (error bars). *, significant differences (p < 0.05) between untreated and treated groups.

