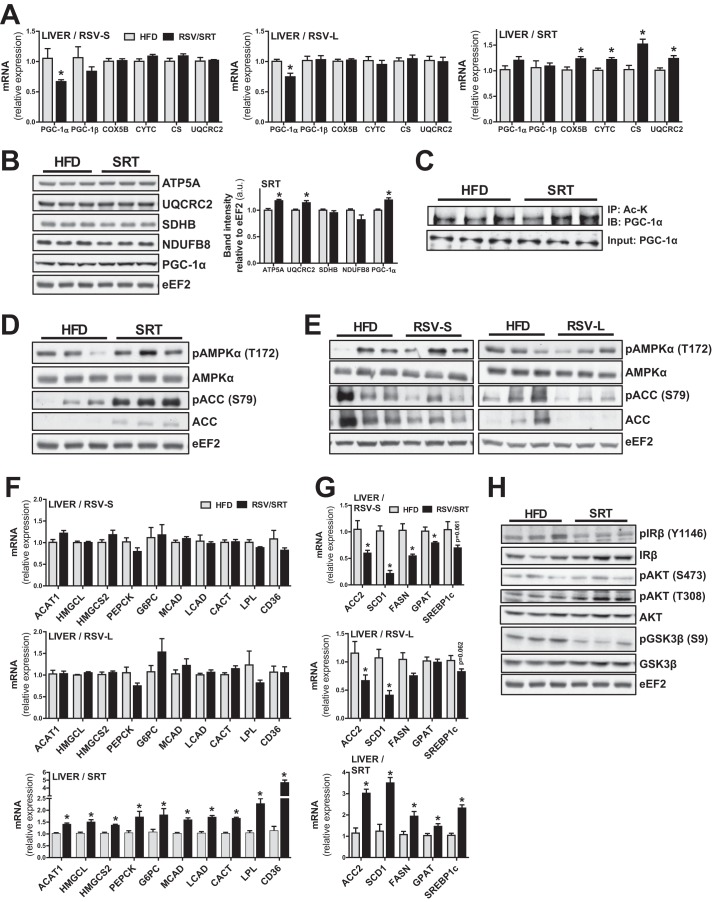
FIGURE 6.
RSV and SRT treatment elicit differential effects on metabolic processes in liver. A, mRNA levels of PGC-1α/β and mitochondrial genes in liver, relative to Rpl0 (RSV-S) or Polr2a (RSV-L, SRT) (n = 5–8/group). B, representative immunoblots of PGC-1α and mitochondrial proteins in liver. Bar graphs show quantification of PGC-1α and mitochondrial protein content relative to eEF2 (n = 6/group). C, immunoprecipitation of acetylated lysines (Ac-K) from hepatic nuclear extracts, followed by immunoblotting against PGC-1α. For the input, an immunoblot against PGC-1α from hepatic nuclear extracts is shown (n = 3/group). D and E, representative immunoblots of AMPKα total protein and AMPKα phosphorylation (Thr-172) as well as ACC total protein and ACC phosphorylation (Ser-79) in liver (n = 6/group). F and G, mRNA levels of genes involved in ketogenesis, gluconeogenesis fatty acid β-oxidation, and fatty acid uptake (F) and lipogenesis (G) in liver, relative to Rpl0 (RSV-S) or Polr2a (RSV-L and SRT) (n = 5–8/group). H, representative immunoblot of IRβ, Akt, and GSK3β as well as their respective phosphorylations (n = 6/group). Bars, means ± S.E. (error bars). *, significant differences (p < 0.05) between untreated and treated groups.

