FIGURE 7.
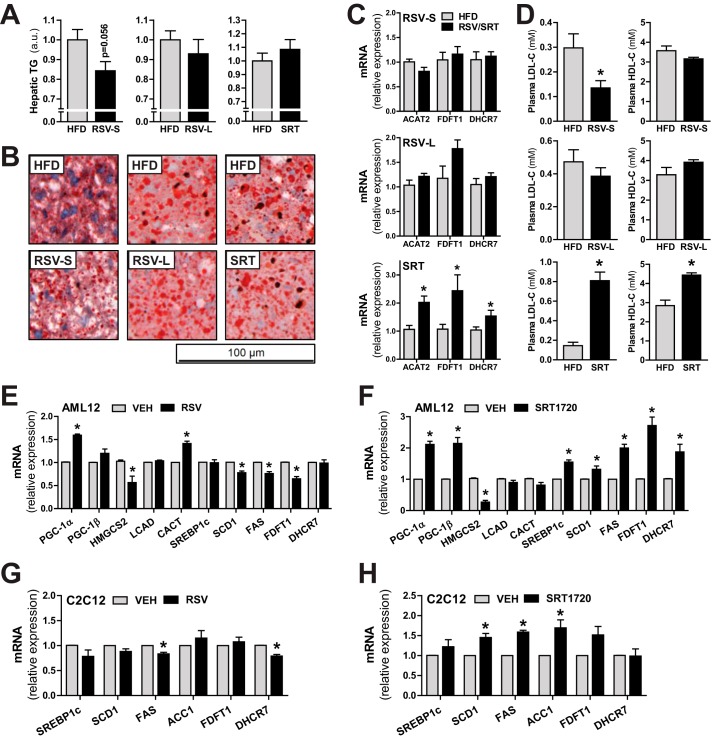
SRT treatment affects lipid homeostasis. A, triglyceride (TG) content in liver expressed in arbitrary units (a.u.), relative to HFD-fed groups (n = 5–8/group). B, representative pictures of Oil Red O staining in liver sections (n = 5/group). C, mRNA levels of genes involved in cholesterol biogenesis in liver, relative to Rpl0 (RSV-S) or Polr2a (RSV-L and SRT) (n = 5–8/group). D, plasma LDL and HDL cholesterol levels (n = 8–10/group). E and F, mRNA levels of the indicated genes in AML-12 mouse hepatocytes treated for 6 h with either 50 μm RSV (E) or 10 μm SRT1720 (F), relative to Tbp (RSV) or Rpl0 (SRT). G and H, mRNA levels of the indicated genes in C2C12 mouse myotubes treated for 24 h with either 50 μm RSV (G) or 10 μm SRT1720 (H), relative to Tbp. Bars, means ± S.E. (error bars). *, significant differences (p < 0.05) between untreated and treated groups.

