FIGURE 1.
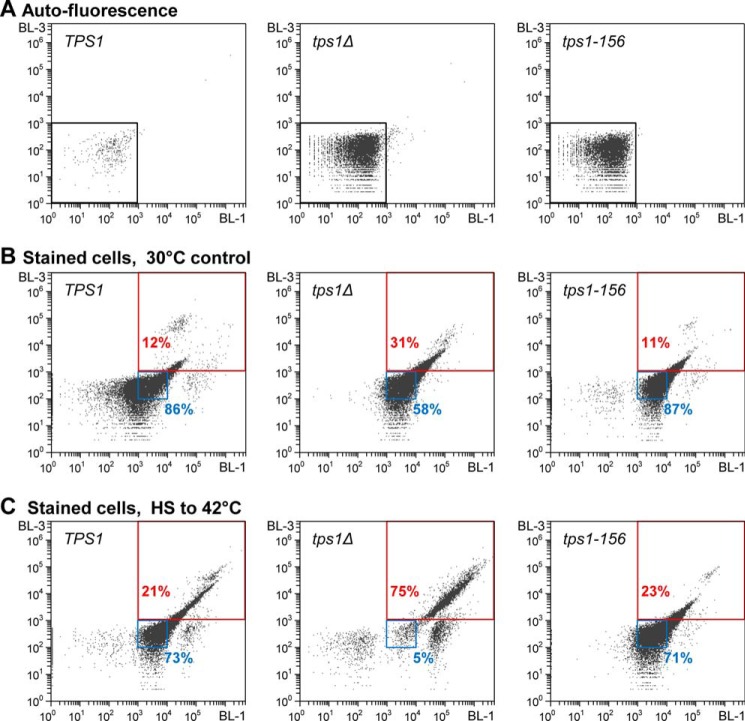
Monitoring cell viability by flow cytometry. Representative BL-1–BL-3 scatter plots (log scale, BL-1 (525-nm filter), BL-3 (670-nm filter)), showing gates positioning, after voltage calibration of the Attune® acoustic focusing cytometer (Life Technologies, Inc.). Plots obtained with exponentially growing cells of the three seminal strains of this work, i.e. TPS1 (left column), tps1Δ (middle column), and tps1-156 (right column). Autofluorescence plots (A), or stained cells fluorescence plots for viability determination, before (B) or after exposure of the cells to 42 °C for 2 h (C). A, cell autofluorescence plots. Voltage calibration was set for optimal positioning of the whole cell population below 103 thresholds (black gate), for both the x axis (BL-1, 525-nm filter) and the y axis (BL-3, 670-nm filter). B, viability determination plots of exponentially growing cells, after staining with the Guava® ViaCount® reagent. x axis, fluorescence intensity of the nuclear dye, which stains only nucleated cells; y axis, fluorescence intensity of the viability dye, which brightly stains dying cells. Positioning of gates for “living” cells (blue gate) and “nonviable” cells (red gate), according to manufacturer's recommendations. Numbers (in %) indicate the fraction of the population in the gate. C, viability determination plots of cells exposed for 2 h to 42 °C. Legend is as in B.

