FIGURE 2.
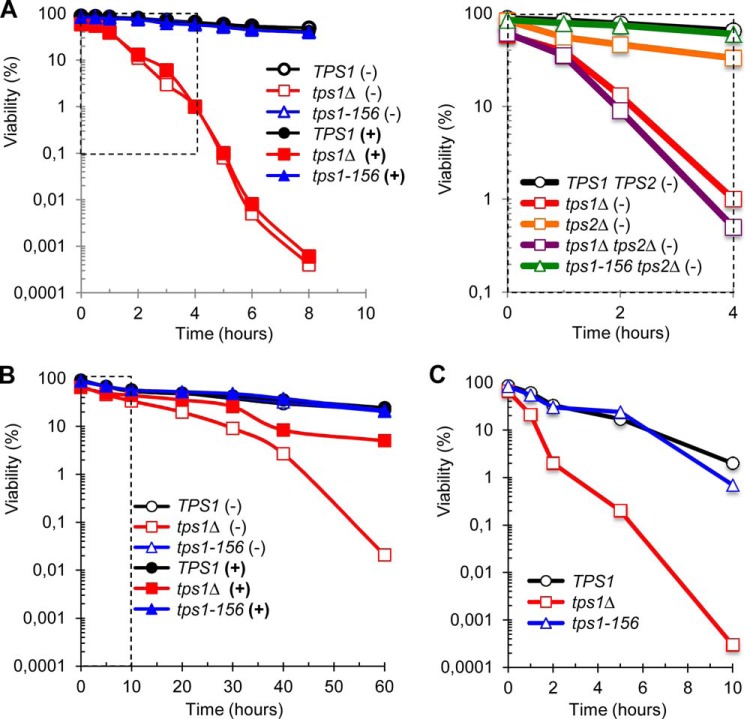
Time-dependent evolution of viability during exposure to heat shock or desiccation. The figure shows the viability of CEN.PK background strains (A and B) in the absence (YN Gal medium, (−)) or in the presence of trehalose (YN GalTre medium, (+)). BY background strains (C) were only grown on YN Gal medium because their mal− genotype precluded the import of trehalose from the medium. The data are represented as means ± S.D. of at least three independent biological replicates. S.D. not plotted on the log scale graphics. A, viability (log scale) as a function of time, in response to heat shock to 42 °C. The dotted line-delimited area in the left panel highlights the scaling for data presented in the right panel. B, viability (log scale) as a function of desiccation time. After desiccation at 30 °C for the indicated time, cell viability was measured after 1 h of rehydration in PBS solution (see Ref. 18 for further details). Control at time 0 corresponds to exponentially growing cells at 30 °C. The dotted line-delimited area highlights the scaling for data presented in C. C, same as in B with BY background strains.

