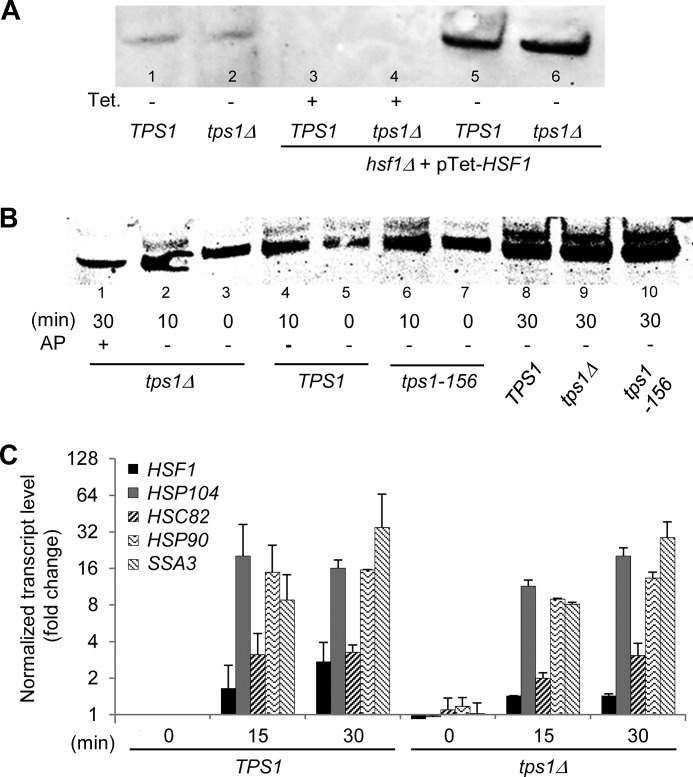
FIGURE 5.
Contribution of Tps1 to thermotolerance is not mediated by Hsf1 transcription factor. A, Western blot analysis of Hsf1 in yeast crude extracts of CEN.PK background strains. In lanes 1 and 2 are shown the native level of Hsf1 in TPS1 and tps1Δ strains. In lanes 3–6 are shown Hsf1 levels expressed from pTet-HSF1 in TPS1 hsf1Δ and tps1Δ hsf1Δ strains. Cells were cultivated in the presence of 0.5 μg/liter tetracyclin (+, expression of HSF1 is down) or in the absence of the antibiotic (−, expression of HSF1 is up). B, heat-induced mobility shift of Hsf1 upon exposure of yeast cells to 40 °C for 10–30 min. Strains were transformed with pTet-HSF1, leading to high expression of the protein. The 30-min tps1Δ sample (lane 1) was also treated by 1 unit of alkaline phosphatase (AP). C, RT-qPCR analysis of HSF1 and HSP transcript levels after exposure of wild type TPS1 and tps1Δ cells to 40 °C for 15–30 min. The values give normalized fold changes (log2 scale) relative to the TPS1 strain before heat shock (time 0), used as the calibrator sample. Normalization was carried out using multiple, validated reference genes (TAF10, ALG9, IPP1, and UBC6). The data are represented as means ± S.D. of two biological replicates.

