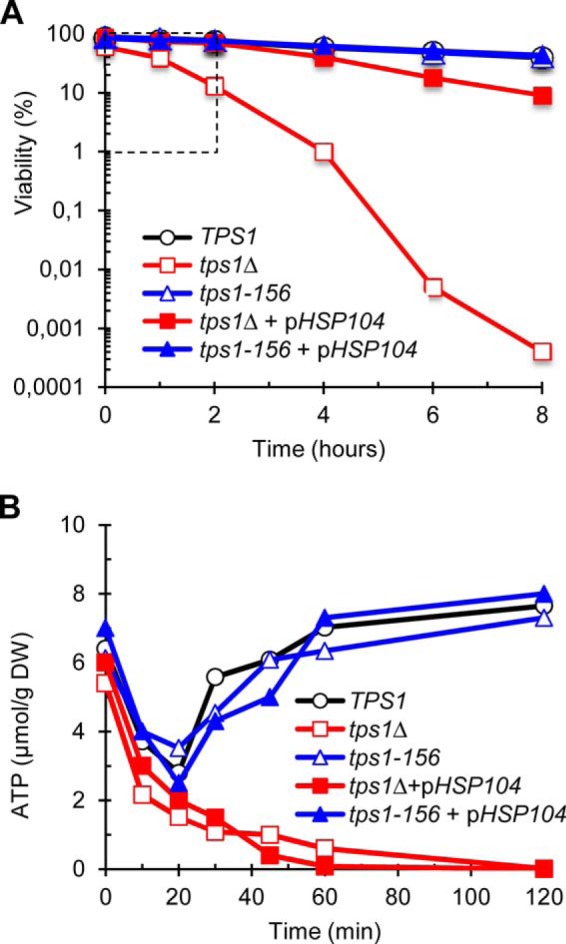
FIGURE 8.

The tps1Δ mutant rapidly loses its ATP content in response to heat shock. A, loss of viability (log scale) as a function of time, in response to heat shock to 42 °C. The dotted line-delimited area highlights the time scaling for ATP levels data presented in B. B, levels of ATP during the first 2 h of exposure to 42 °C. The strains tps1Δ and tps1-156 were transformed with a 2μ empty plasmid or with pHSP104. The data are represented as means ± S.D. of three independent biological replicates.
