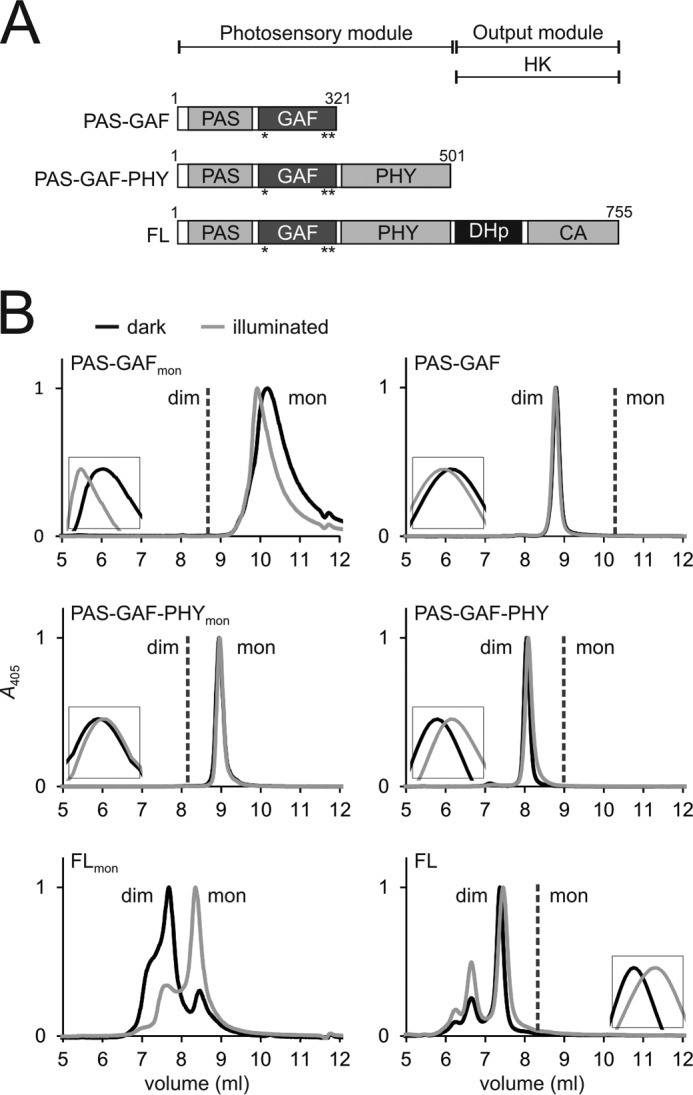
FIGURE 1.

Domain organization and size-exclusion analysis of the phytochrome constructs. A, schematic presentation of the phytochrome fragment used. Mutated residues are indicated as asterisks (*). CA, catalytic ATP binding domain). B, the size exclusion of the monomer mutants is shown in the left panels, and the wild-type constructs are shown in the right panels (28). To consider exclusively holoproteins, the retentions are plotted at a 405-nm wavelength. Samples in the dark (Pr) state are plotted as black lines; the illuminated (Pfr-like) samples are plotted as gray lines. Insets show each retention peak in higher magnification. Whether the construct elutes as monomers (mon) or dimers (dim) is indicated in the figure. The calculated molecular masses are 65 kDa (PAS-GAF-PHYmon) and 220/116 kDa (FLmon). The size of PAS-GAFmon has not been approximated because the sample eluted outside the optimal resolution range of the column. The elution profiles verify that the PAS-GAF-PHY mutant is exclusively monomeric. However, the full-length mutant elutes as a monomer/dimer mixture. The Pr state favors dimers and the Pfr state monomers. Note that the dimeric (28) and monomeric proteins were run at slightly different buffer conditions causing a slight drift of the retention peaks.
