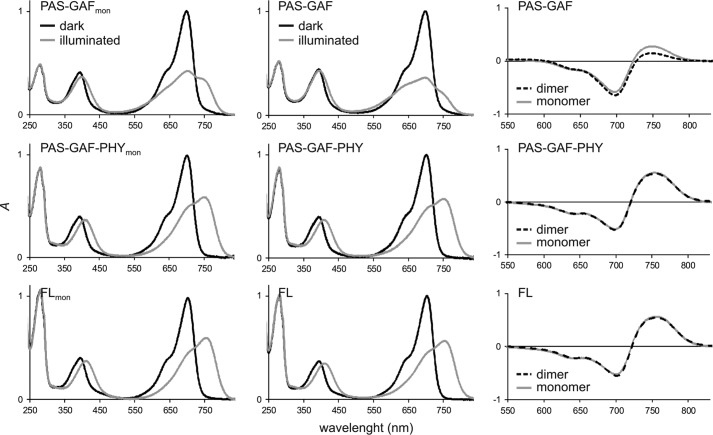
FIGURE 2.
Absorption spectra of the phytochrome constructs. The left and middle panels show the absorption spectra of the monomer mutants (left) and their wild-type counterparts (middle). Dark (Pr) sample spectra are plotted as black lines, and illuminated (Pfr or Pfr-like) sample spectra are plotted as gray lines. The wild-type fragment spectra (17, 28) and the PAS-GAFmon spectra (42) are published elsewhere and are shown here for comparison. The PAS-GAF-PHY and full-length mutants show almost identical spectra with their wild-type counterparts, whereas the PAS-GAF spectra of the illuminated state are different. The right panels show the Pfr-minus-Pr difference spectra of all six constructs. The difference spectra show that the wild-type and mutant spectra are almost identical in the case of PAS-GAF-PHY and full-length phytochrome, whereas they differ in PAS-GAF fragments.

