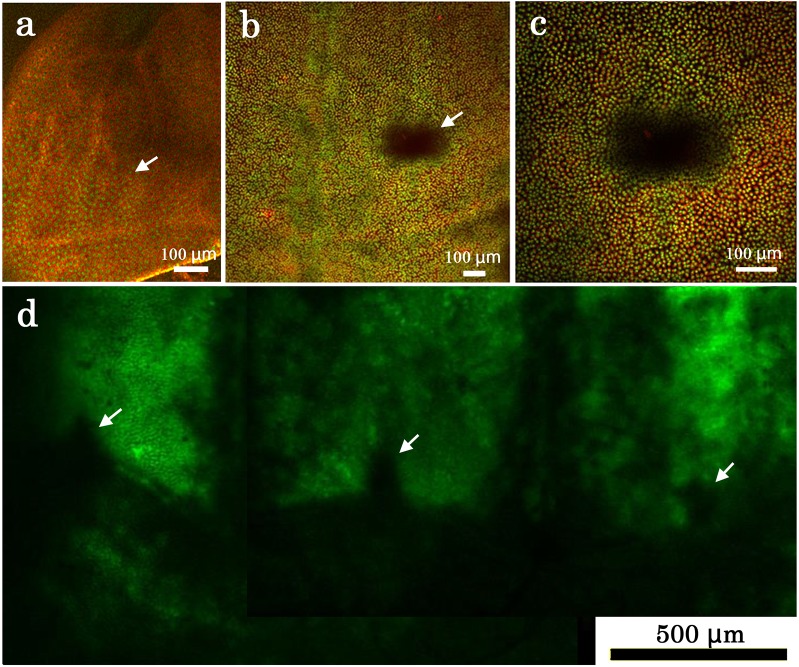
Fig 12. Staining pattern of a prospective eyespot area and edge spots.
(a) A larval wing imaginal disk. Stained with SYBR Green I for nuclei and MitoTracker Orange for mitochondria. A white arrow indicates a prospective eyespot area, as judged by venation pattern. (b) Pupal wing tissue stained with SYBR Green I for nuclei and MitoTracker Orange for mitochondria. A white arrow indicates a prospective eyespot area. (c) High magnification of a prospective eyespot area shown in (b). (d) Peripheral area of a pupal wing tissue stained with CFSE. Arrowheads indicate pupal edge spots.

