Extended Data Figure 6.
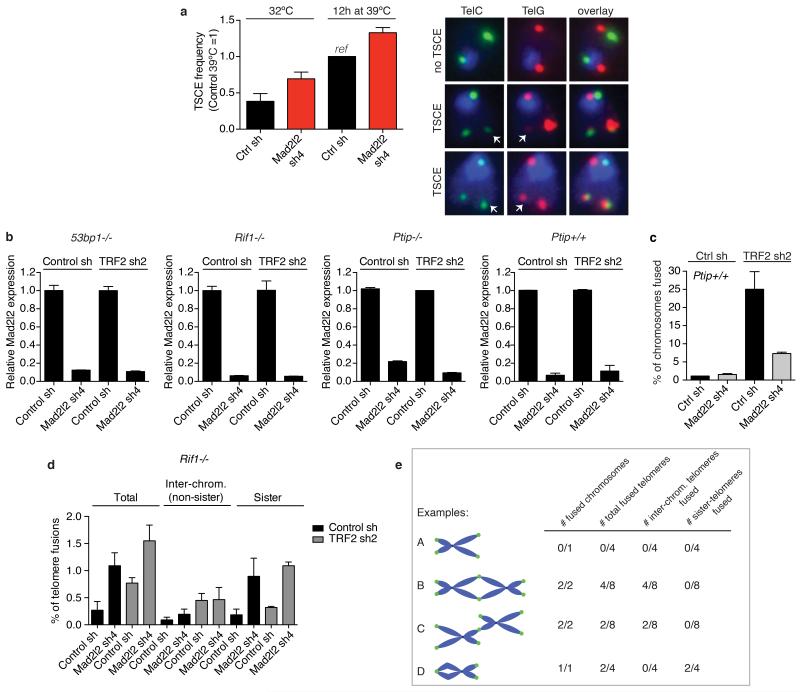
a, TSCE analysis in shRNA-transduced TRF2ts MEFs grown at 32°C or for 12 h at 39°C to uncap telomeres (n=2, ± s.d., counting >1,000 chromosomes per condition, per experiment). TSCE frequency in control cells is set at 1 (corresponding to an average of 6.9% of chromosomes with a TSCE event). Shown on the right are examples of chromosomes without and with TSCE in cells quantified on the left. b, qRT-PCR analysis of Mad2l2 expression levels in 53bp1−/−, Rif1−/−, Ptip−/− and Ptip+/+ MEFs used in the chromosome fusion analysis shown in Fig. 4a and in c (Error bars: s.d.). c, Percentage of chromosomes fused upon TRF2 inhibition in the Ptip+/+ MEFs matching with the Ptip−/− MEFs shown in Fig. 4a (n=2, ± s.e.m.). d, Analysis of different types of telomere fusions in Rif1−/− MEFs. Depletion of MAD2L2 in Rif1−/− MEFs does not reduce inter-chromosomal telomere fusions induced by TRF2 inhibition, indicating epistasis. However, irrespective of TRF2 inhibition, MAD2L2 depletion in Rif1−/− MEFs induces association between sister-telomeres, causing an increase in total fusions scored for MAD2L2-depleted Rif1−/− MEFs, as also visible in Fig. 4a (n=2, ± s.e.m., >1,300-2,000 chromosomes were analysed per condition, per independent experiment). e, Explanation of scoring different types of telomere fusions shown in d.

