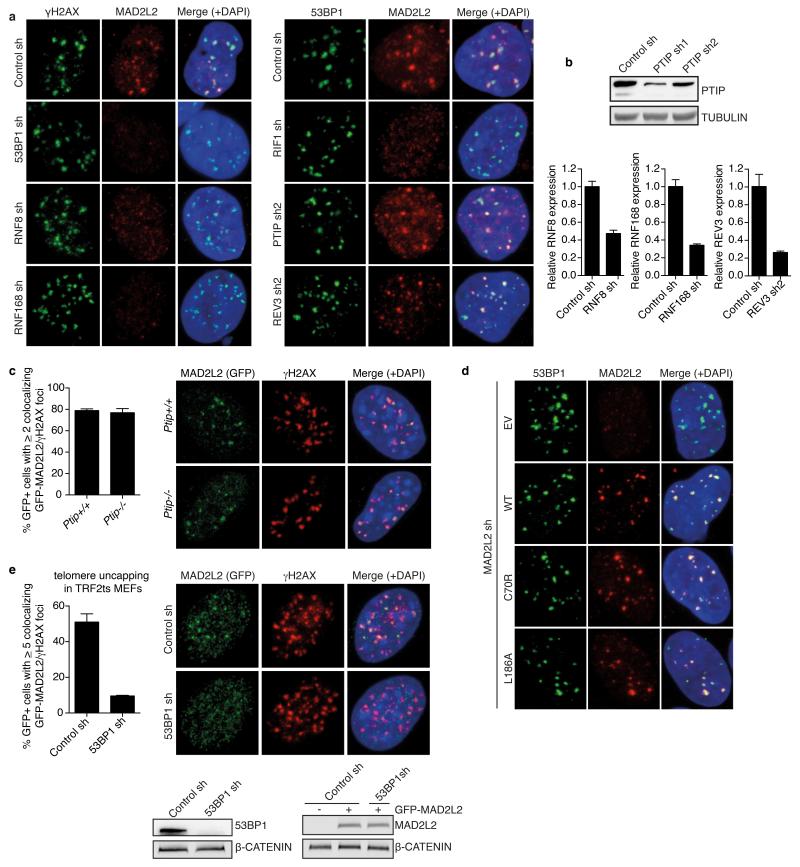
Extended Data Figure 8.
Related to Figure 4
a, Representative images of IF detection of endogenous MAD2L2 and γH2AX or 53BP1 in U2OS cells transduced with control, 53BP1, RNF8, RNF168, RIF1, PTIP or REV3 shRNA lentiviruses, irradiated with 5Gy and processed for IF after 3h (quantifications are shown in Fig. 4e). b, Western blot or qRT-PCR analysis of PTIP, RNF8, RNF168 and REV3 levels in shRNA-transduced U2OS cells (Error bars: s.d.). c, Quantification and representative images of IF detection of γH2AX and GFPMAD2L2 in Ptip+/+ or Ptip−/− MEFs, 3h after 5Gy (n=2, ± s.d.). d, Representative images of IF for 53BP1 and exogenous Flag-MAD2L2 WT, C70R or L186A in U2OS cells depleted for endogenous MAD2L2 with lentiviral shRNA, processed for IF 3h after 5Gy (quantifications are shown in Extended Data Fig. 7e). e, Quantification and representative IF images of GFP-MAD2L2 localisation to uncapped telomeres in TRF2ts MEFs transduced with control or 53BP1 shRNAs (n=2, ± s.d.).

