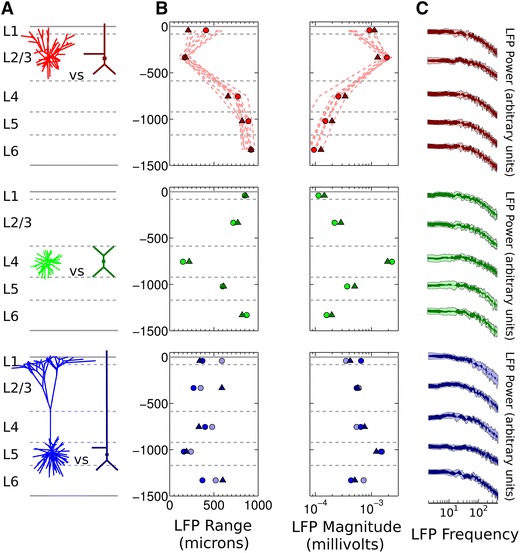
Fig. 1.

Comparison of simulated LFPs from the Bush and Mainen cell models. Top (red) L2/3 pyramidal neuron, middle (green) spiny stellate cell (morphology also used for interneurons), bottom (blue) L5 pyramidal neuron. a Comparison of original and reduced multi-compartment models of each neuron type. b Range and magnitude of simulated LFPs. Circles show values for the original cell reconstruction populations, triangles for the reduced neuron model populations. Light red dashed lines in the top panel and light blue circles in bottom panel show values for the extra cat pyramidal neurons tested, as described in the main text. All y-axis values in μm. c Overlap of the 95 % confidence intervals for the estimated LFP power spectra produced by each population in each layer shaded dark. Non-overlapping sections of the 95 % confidence intervals are shaded light. Power is plotted in dimensionless, normalised units for ease of comparison
