Fig. 4.

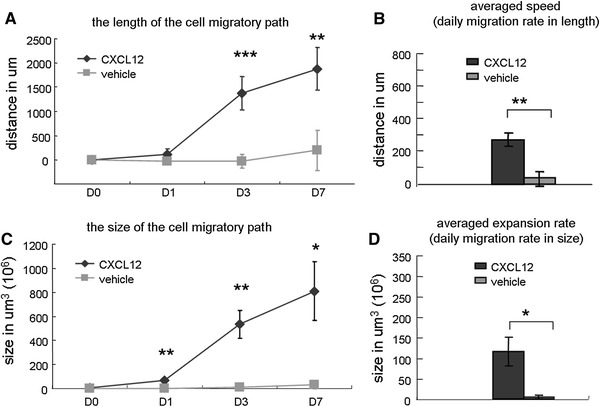
Measuring spontaneous and induced migration along the CC on cellular MRI. a In length, CXCL12 induced the NPCs to migrate with time over an extensive range from the grafted area. CXCL12-induced migration was nearly nine times as long as the vehicle-induced migration. b The averaged migration speeds were 269 ± 41 and 29 ± 45 μm/day for the CXCL12 and vehicle groups, respectively. c The migratory path increased in size with time. The size of CXCL12-induced migration was 28.7 times as large as vehicle-induced migration (i.e., spontaneous). d The average expansion rates from D0 to D7 were 115 ± 35 × 106 and 4 ± 4 × 106 μm3/day for the CXCL12 and vehicle groups, respectively
