
Fig. 7.
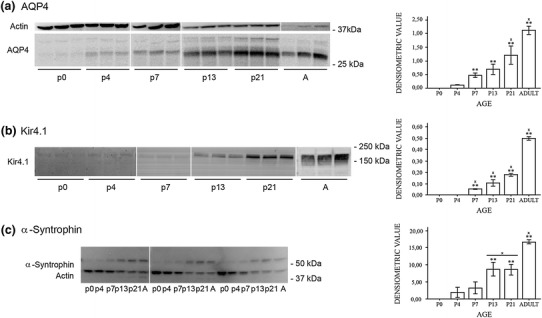
AQP4, Kir4.1, and α-syntrophin increase towards adulthood. Western blots of whole brain homogenates from the postnatal day 0 to 21 (P0–P21) and adult (A) mice. Representative immunoblots for AQP4, Kir4.1, and α-syntrophin (left panels) and corresponding quantitation (densitometric values; right panels). a The AQP4 antibody labelled two bands at about 30 kDa corresponding to the M1 and M23 isoforms of AQP4. A third band around 35 kDa was not included in the quantitative analysis. β-Actin was used as loading control. The densitometric analysis revealed an increasing immunosignal for AQP4 protein in the postnatal period. b Immunoblot of Kir4.1 revealed a major band at ≈200 kDa which corresponds to the tetrameric form of Kir4.1 (Connors and Kofuji 2006; Olsen et al. 2006). Ponceau red staining was used as loading control (not shown). The developmental pattern mimics that of AQP4 (a). c Immunoblot of α-syntrophin revealed a major band at 59 kDa and a weaker band at slightly higher molecular weight. The major band––absent from α-syntrophin knockout brains––was used for quantitative analysis. β-Actin was used as loading control. The expression pattern for α-syntrophin was similar to those of AQP4 and Kir4.1. **Significantly different from P0 and ‘x’ significantly different from previous value. Error bars indicate ±2 SE, p = 0.05