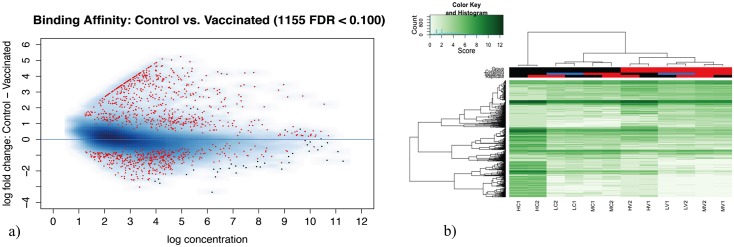
Fig 2.

Differentially methylated regions visualization and cluster of samples considering their methylation levels a) The MA plot shows in red the differentially methylated regions obtained with a false discovery rate of < 0.1 b) Heat-map of samples demonstrates a perfect classification of the condition of the individuals based on methylation levels in the differentially methylated regions.
