Figure 5.
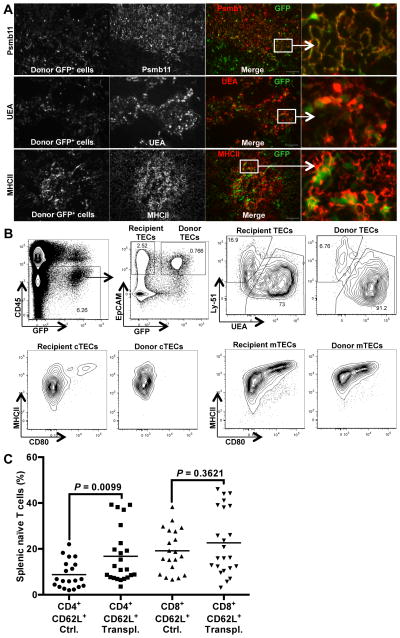
Thymic epithelial cells engraft and maintain functional phenotypes upon intrathymic transplantation. (A) Sections from recipient thymuses from Figure 4 were fixed in PFA, and analyzed for GFP+ engrafted cells (first column). Sections were analyzed for co-expression of GFP and Psmb11 (top row), UEA (middle row), and MHCII (bottom row), Psmb11+, UEA+, and MHCII+ cells are shown in gray scale (second column). In merged images (third and fourth columns), GFP+ cells are shown in green, and Psmb11+, UEA+, or MHCII+ cells in red. Boxed areas are zoomed in and shown in the fourth column. Scale bar represents 100 μm. The images are representative of 5 recipient thymuses. (B) Thymuses from transplanted mice shown in Figure 4A and 4B were enzymatically dissociated into single cells. Isolated cells were stained for CD45, EpCAM, MHCII, Ly-51, UEA and CD80 and analyzed by flow cytometry. Plots show one well-engrafted thymus, from more than 10 similar experiments. The gating strategy to identify donor TECs is shown (CD45−, GFP+, and EpCAM+). Donor-derived TECs and endogenous recipient TECs were further analyzed for the expression of Ly-51 (cTECs) and UEA (mTECs). (C) Splenocytes from transplanted (Transpl.) and control (Ctrl.) mice shown in Figure 4A and 4B were prepared into single cells and stained for CD4, CD8, CD44 and CD62L to distinguish naïve and memory T cells. The percentages of naïve CD62L+CD4+ cells and naïve CD62L+CD8+ cells within the total CD4+ and CD8+ populations, respectively, are shown in the graph. Mean values for each group are shown as bars. P values were determined using the unpaired Student’s t-test

