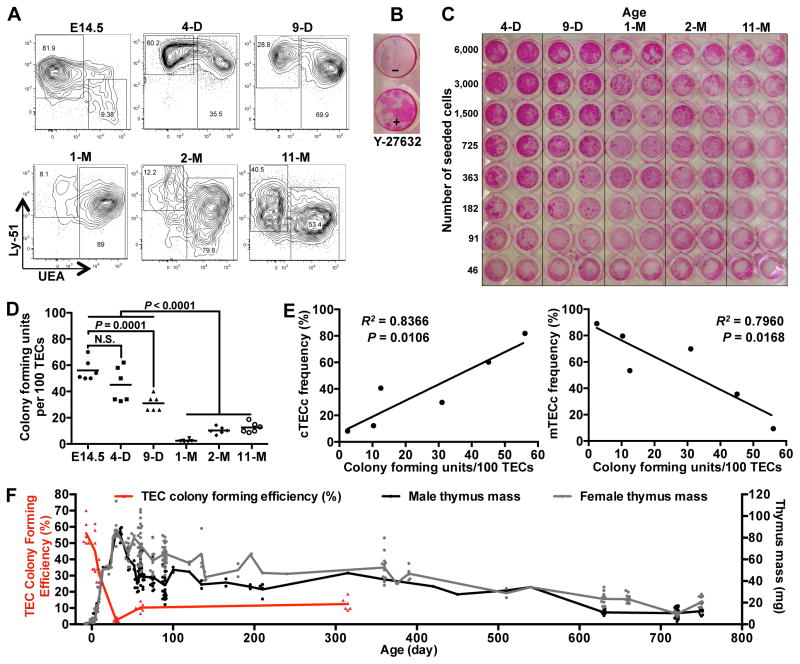
Figure 8.
The in vitro proliferative capacity of TECs declines rapidly with age. (A) Thymuses of E14.5, 4-day (4-D), 9-day (9-D), 1-month (1-M), 2-month (2-M), and 11-month (11-M) old GFP-transgenic mice were proteolytically digested, stained for TEC markers and analyzed by flow cytometry. Each plot shows TECs that were pre-gated on live, CD45−EpCAM+ cells. (B) Sorted CD45−EpCAM+Ly-51+ TECs were seeded onto irradiated MEFs (800 TECs/well) in the presence or absence of ROCK inhibitor, Y-27632. After two weeks, wells were fixed and stained with Rhodamine B to visualize colonies. TEC colonies appear as dark red spots within the wells. The experiment is representative of more than 10 similar experiments. (C) Live, CD45−, EpCAM+ cells from (A) were sorted and plated in a 96-well plate at the indicated cell numbers per well in the presence of Y-27632. At 8-days post-seeding, colonies were visualized as in (B). Image represents one of two separate experiments. (D) GFP+ TEC colonies from each well were manually counted under an inverted fluorescence microscope on day 5 of the culture (prior to fixing in PFA, as shown in (C)). Each point on the graph represents the number of TEC colonies per 100 TECs plated, determined from 6 wells that contained large numbers of distinct, separate colonies. Mean colony counts are shown as bars. (E) The percentages of TEC colony forming units as shown in (D) are plotted against cTEC and mTEC frequencies as shown in (A). (F) Thymus masses of mice of the indicated ages were measured and plotted together with the data from TEC colony forming unit efficiency (D). P values were determined using the unpaired Student’s t-test (D) or F-test (E).

