
Fig. 3.
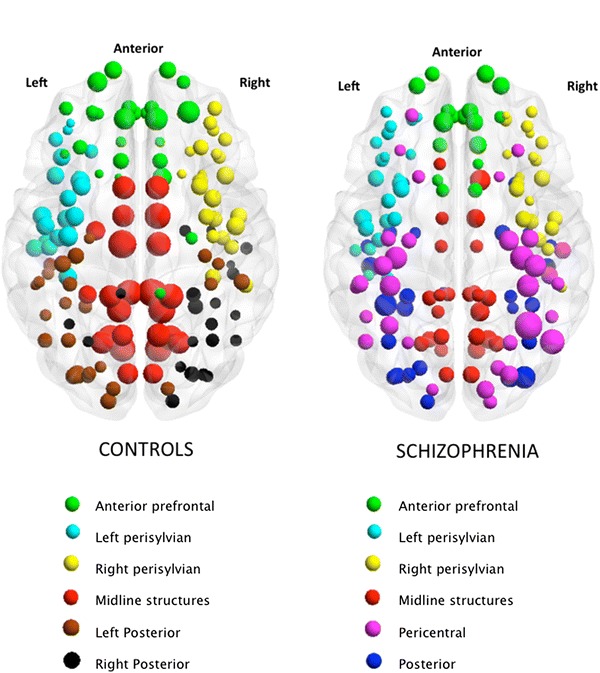
Graphical representation of gyrification networks in controls (CON) and patients with schizophrenia (SCZ), visualized using BrainNet viewer (http://www.nitrc.org/projects/bnv). Both CON and SCZ networks had 6 modules each discovered using Newman’s module detection algorithm, coded separately for each network. The size of the nodes is proportional to the degree centrality. A colour figure showing module membership of individual nodes is provided online