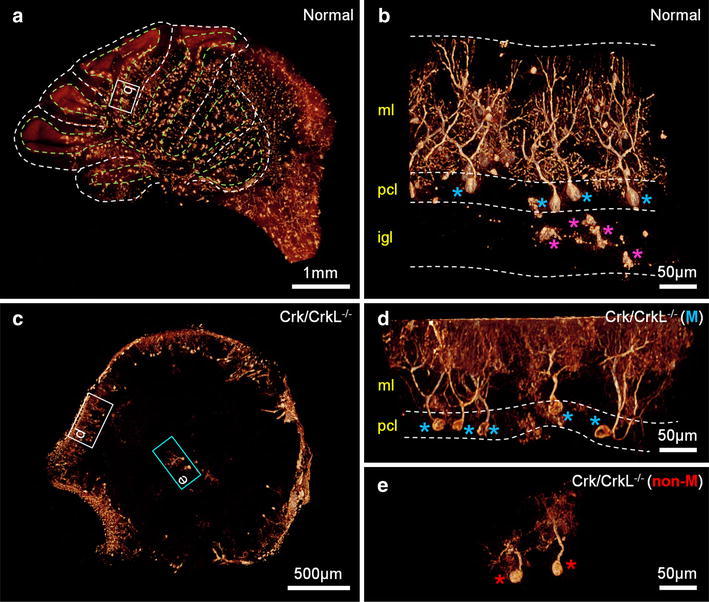
Fig. 2.

3-D tomographic volume-rendered images of cerebellar tissues. a 3-D image of an entire cerebellum in a normal mouse (Movie S1). The lobular and PC layer structures are marked by the white and light green dashed lines, respectively. b 3-D magnified image of the white box region in panel a (Movie S2). PC and granule cells are marked by blue and magenta asterisks, respectively. The cerebellar layer arrangement is described by the white dashed lines. ml molecular layer; pcl PC layer, igl internal granular cell layer. c 3-D image of an entire cerebellum in a Crk/CrkL knockout mouse (Movie S3). Migrated and non-migrated PC are marked by the white and cyan blue boxes, respectively. d 3-D magnified image of the white box region in panel c (Movie S4). Migrated PC are marked by blue asterisks. ml molecular layer, pcl PC layer. e 3-D magnified image of the cyan blue box region in panel c (Movie S5). Non-migrated PC are marked by red asterisks
