Fig. 5.

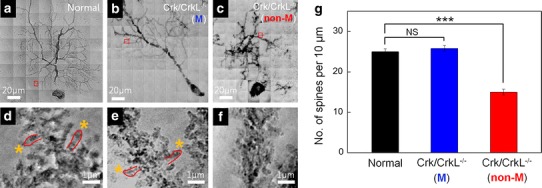
Nano-radiographic images of PC spines and quantitative analysis of their densities. a–c Entire PC nano-images of a normal, a migrated and a non-migrated Crk/CrkL knockout PC. d–f Magnified images of the box regions in panels a–c, respectively. g Spine numbers per 10 μm of dendrites. Ten mice were analyzed for each group. The error bars correspond to the SEM. NS not significant; ***p < 0.001 compared to normal
