
Fig. 1.
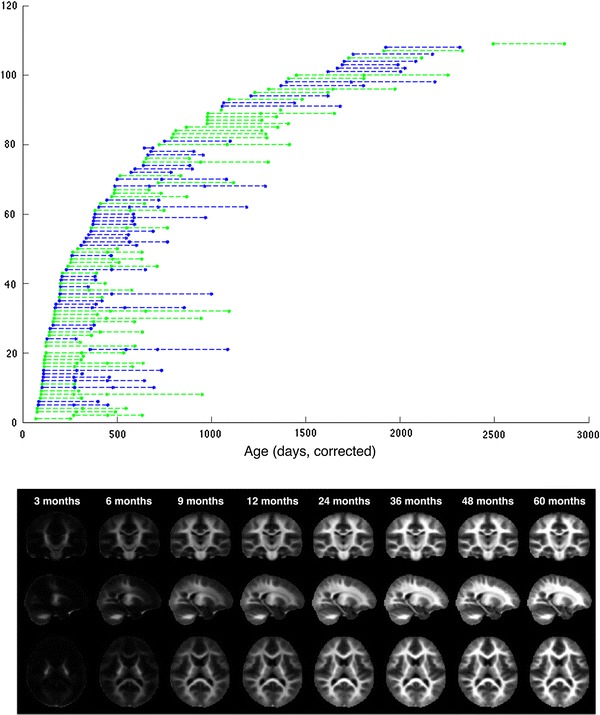
Top row: ages of the 108 subjects at each scan. Each row denotes an individual subject and the repeated measurements are connected with a dashed line. Males (blue) and females (green) are additionally distinguished. Bottom row: mean mcDESPOT VFM maps at 3, 6, 9, 12, 24, 36, 48, and 60 months of age illustrating the development of myelinated white matter throughout the brain