
Fig. 4.
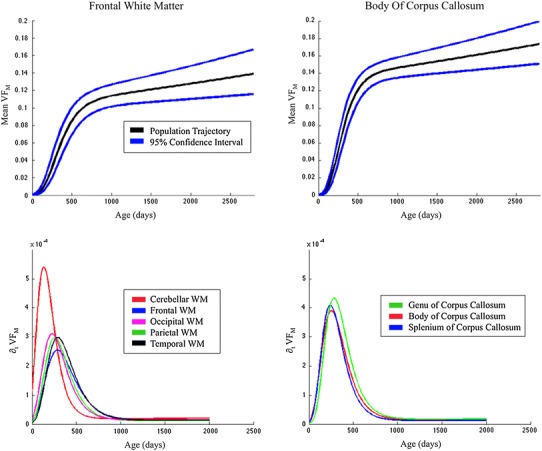
Top Row: 95 % confidence intervals for the frontal white matter and body of the corpus callosum. Using the standard error estimates from the nonlinear mixed effects modeling, confidence intervals of the population trajectory can be estimated. Bottom row: representative VFM growth rate curves. These curves were reconstructed by taking the time derivative of the modified Gompertz function (Eq. 2) and using the overall population estimates of the modified Gompertz parameters. Such curves are informative of the rate of change of the VFM with respect to age (time) and highlight the posterior–anterior developmental gradient of VFM