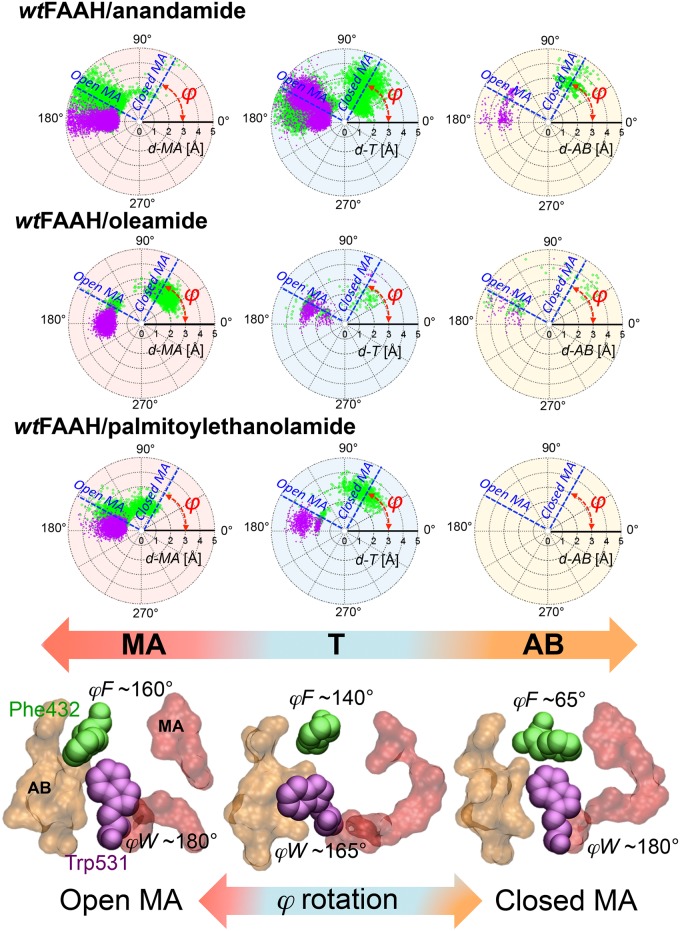
Fig 5. Polar plots of the φ angle (dihedral angle along the Cα-Cβ axis) of Phe432 (φF—green dots) and Trp531 (φW—violet dots) with respect to the d-MA (red background), d-T (cyan background), and d-AB (yellow background) distances for pre-reactive conformations of the wtFAAH/anandamide (first row), wtFAAH/oleamide (second row), and wtFAAH/palmitoylethanolamide (PEA—third row) systems.
The polar (d-MA, d-T and d-AB) and angular (φ—in red on the plot) coordinates are explicitly indicated on the plots. The approximate values of φF of Phe432 for the “open” and “closed” MA channel configurations are highlighted with blue dashed bars. Distances and angles are expressed in Å and degrees, respectively. Definitions of the d-MA, d-T and d-AB distances are reported in the Methods section. Selected snapshots from MD simulations indicating the “open” (left) and “closed” (right) MA channel configurations, as induced by the rotation of the φ angle of Phe432 and the cooperative Trp531, are shown at the bottom of the polar plots. The MA (red) and AB (orange) channels are represented in molecular surfaces. Phe432 (green) and Trp531 (violet) are shown in space-filling representation. The φ angle of the two residues is explicitly reported.

