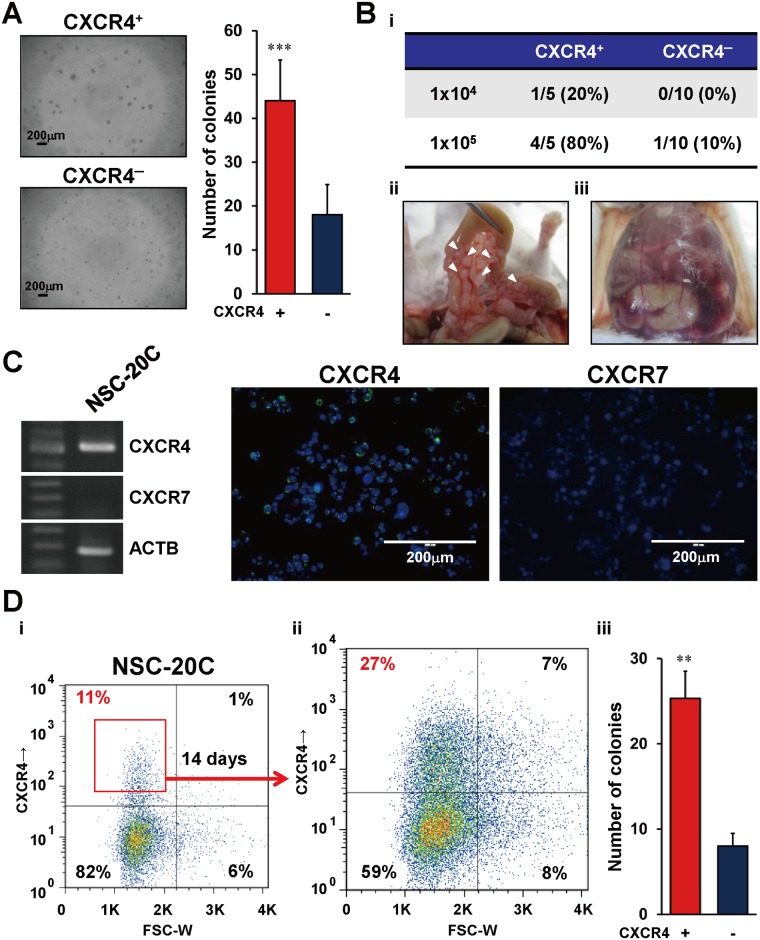
Fig 3. Tumorigenicity of CXCR4+ small cells sorted from 60As6 and primary cultured GC cells.
(A) Representative images of anchorage independent growth of CXCR4+ small cells and CXCR4- small cells in colony formation assay (left). Quantitative analysis of cell growth using CyQuant GR dye (right) (n = 3, mean + SE; ***p<0.001). Scale bars represent 200μm. (B) Tumor formation frequency of CXCR4+ small cells and CXCR4- large cells in xenograft mice (Bi). The lower panels show representative macroscopic findings of multiple tumor nodules (Bii, arrowhead) along with the intestine and bloody ascites (Biii) in a SCID/SCID mouse. (C) RT-PCR (left panel) and immunocytochemical staining (right panels) of CXCR4 (green) and CXCR7 (green) in primary cultured GC cells (NSC-20C). Scale bar represents 200μm. (D) Flow cytometric analysis in primary cultured GC cells (NSC-20C) (Di) and sorted CXCR4+ cells after cultivating for 14 days (Dii). Colony formation assay of CXCR4+ and CXCR4- small cells derived from NSC-20C cells (n = 3, mean + SE; **p<0.005) (Diii).

