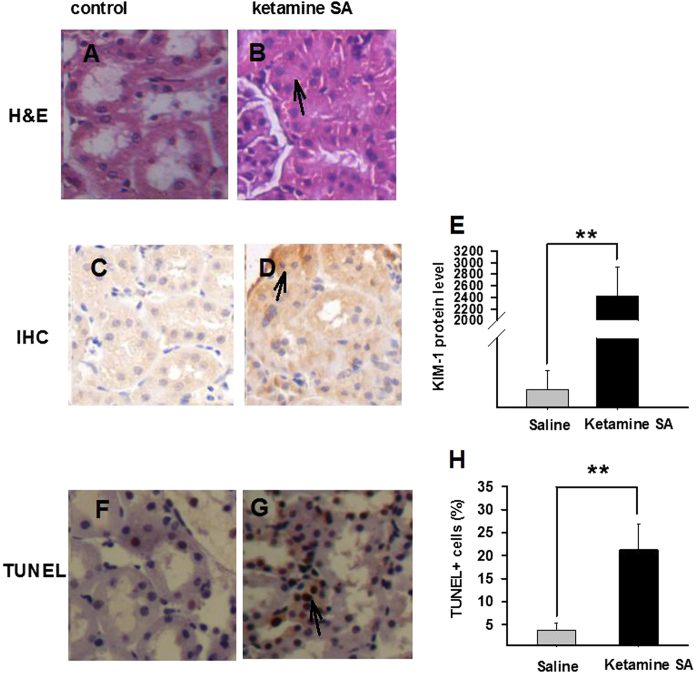
Figure 3. Effects of ketamine SA on morphological alterations and toxicity of the kidney.
(A,B) Representative images of H&E staining for a saline and a ketamine SA rat. Arrow represents tubular atrophy. (C,D) Representative images of IHC staining for a saline and a ketamine SA rat. Arrow represents a cell with positive expression of KIM-1. (E) KIM-1 levels for saline (left) and ketamine SA (right) groups (F,G) Representive TUNEL staining images for a saline (left) and a ketamine SA (right) rat. (H) TUNEL + cells (%) for saline (left) and ketamine SA (right) groups. Arrow represents an apoptotic cell. Data are expressed as mean ± SEM. ** p < 0.01. SA: self-administration; KIM-1: kidney injury molecule 1; TUNEL: Terminal deoxynucleotidyl transferase-mediated dUTP nick end-labeling staining. The KIM-1 level was defined as the average integral optical density.

