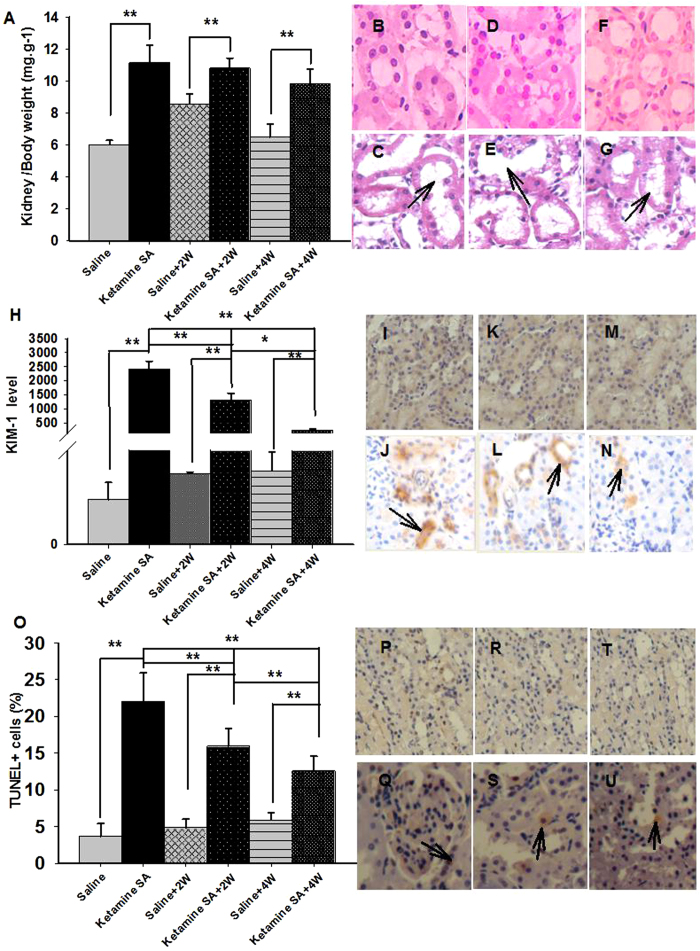
Figure 5. Effects of the duration of abstinence on renal toxicity induced by ketamine SA.
(A) The kidney and body weight ratio of the Ketamine SA, Ketamine SA + 2 W and Ketamine SA + 4 W groups and their corresponding control (Saline, Saline + 2 W, Saline + 4 W) groups (B–G). Representative images of H&E staining for a Saline, a Ketamine SA, a Saline + 2 W, a Ketamine + 2 W, a Saline + 4 W and a Ketamine SA + 4 W rat. Arrow represents tubular enlargement and edema (H) KIM-1 levels of the Ketamine SA, Ketamine SA + 2 W and Ketamine SA + 4 W groups and their corresponding control (Saline, Saline + 2 W, Saline + 4 W) groups. (I–N) Representative images of IHC staining for a Saline, a Ketamine SA, a Saline + 2 W, a Ketamine + 2 W, a Saline + 4 W and a Ketamine SA + 4 W rat. Arrow represents a cell with positive expression of KIM-1. (O) TUNEL + cells (%) of the Ketamine SA, Ketamine SA + 2 W and Ketamine SA + 4 W groups and their corresponding control (P–U). Representative images of TUNEL staining for a Saline, a Ketamine SA, a Saline + 2 W, a Ketamine + 2 W, a Saline + 4 W and a Ketamine SA + 4 W rat. Arrow represents an apoptotic cell. Data are expressed as mean ± SEM. KIM-1: Kidney Injury Molecule 1; TUNEL: Terminal deoxynucleotidyl transferase-mediated dUTP nick end-labeling staining; SA: self-administration; W: week; KW: kidney weight; BW: body weight.

