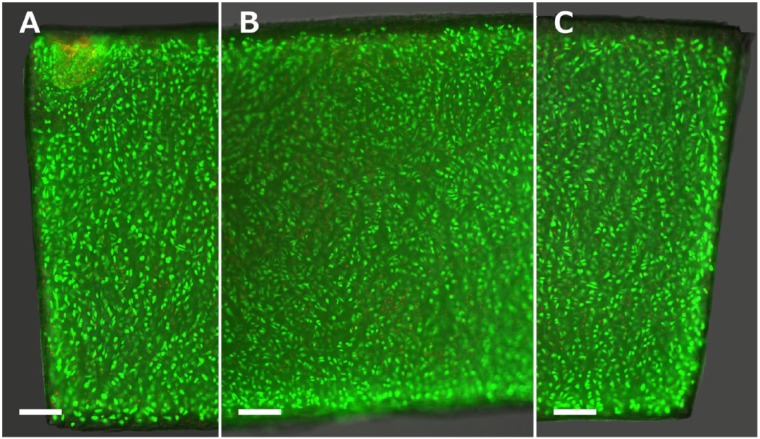
Figure 3.
Calcein-acetoxymethyl ester and propidium iodide (CAM–PI) staining of a representative cartilage section before the load is applied. The image shows the left border (A), middle section (B), and right border of the cartilage strip (C). The nuclei of live and dead cells are stained green and red, respectively. Scale bar = 250 µm.

