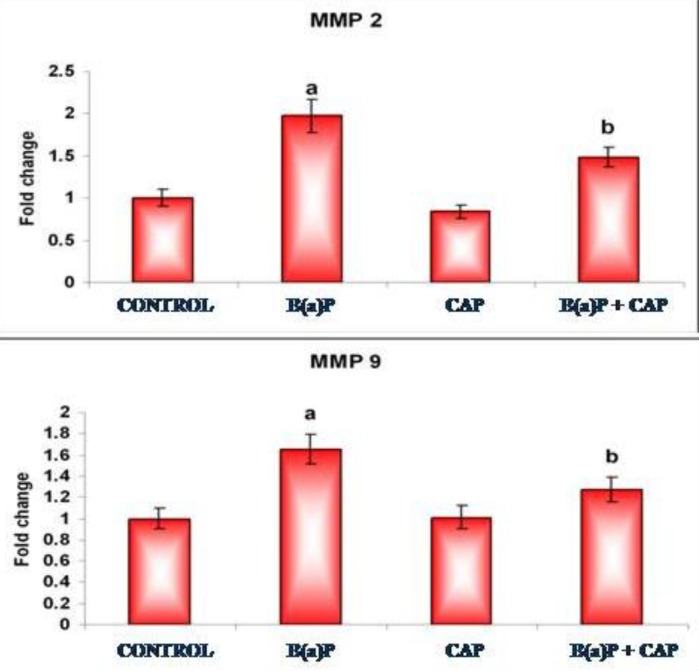
Fig. 4b. Densitometric analyses of MMP-2 & MMP-9.
Densitometry data were presented as ‘‘fold change’’ as compared with the control group. Each value is expressed as mean ± S.D. for six mice in each group. (a) Statistical significance is at P < 0.05 as compared with Group I, (b) Statistical significance is at P < 0.05 as compared with Group II. S.D., standard deviation; MMP, matrix metalloprotease; B(a)P, benzo(a)pyrene; CAP, capsaicin.

