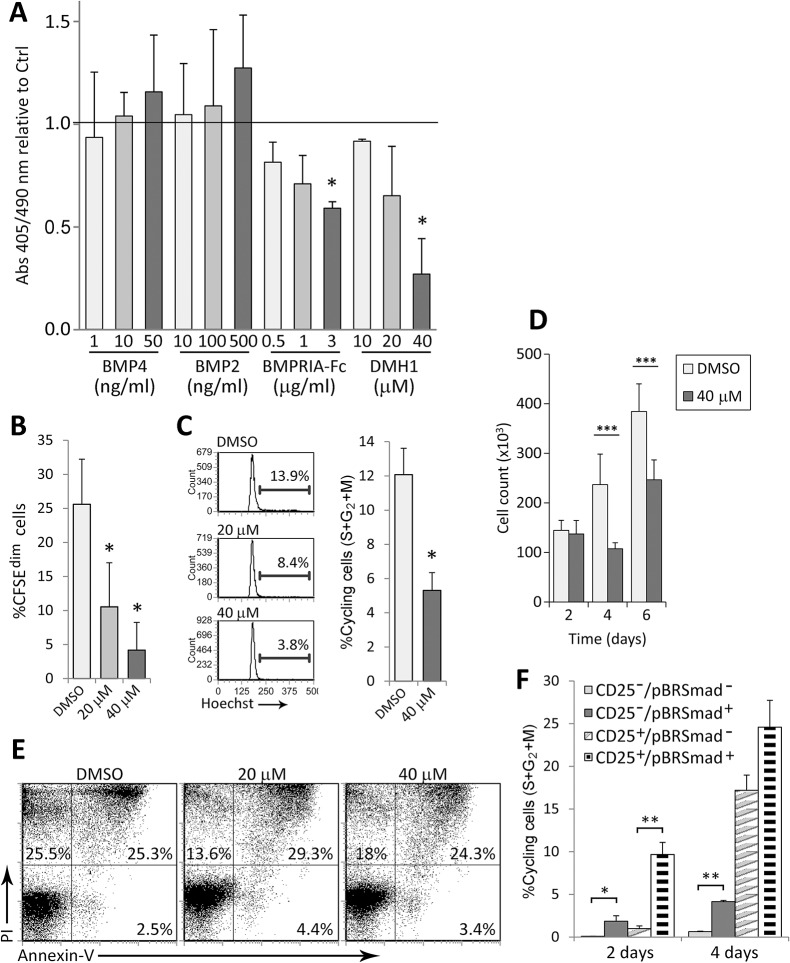
Fig 3. Canonical BMP pathway inhibition impairs T cell proliferation.
(A) BrdU incorporation after 4 days of TCR stimulation with the indicated treatments. Results are represented as absorbance relative to control (horizontal bar). Means ± SD of two independent experiments run in duplicates are shown (* p≤0.05; by t test). Control refers to no treatment for BMP2 and BMP4, unspecific immunoglobulins for BMPRIA-Fc and DMSO for DMH1. (B-D) After 4 days of TCR stimulation in the presence of DMSO or DMH1, the proliferation rate, measured by CFSE loss (B), Hoechst staining (C) and number of cells recovered (D), and the percentage of apoptotic/necrotic cells (E) were analyzed by flow cytometry. Bars represent means ± SD of five independent experiments (* p≤0.05; by t test). Cell counts were performed in duplicates and the means ± SD of at least 4 independent experiments are shown. Histograms in (C) and dot plots in (E) correspond to one representative experiment. (F) Cells were harvested at the indicated time points and stained for CD25, phosphorylated Smad-1/5/8 (pBR-Smad) and Hoechst. Cell populations were defined according to the expression of CD25 and pBR-Smad and the percentage of Hoechst positive cells was determined for each subset. Means ± SD of three independent experiments are shown (* p≤0.05; ** p≤0.01; by t test).

