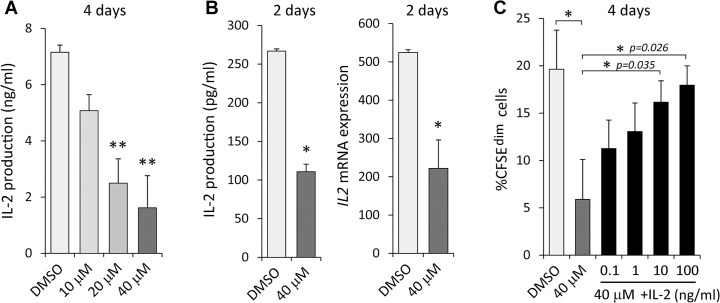
Fig 4. DMH1 effects on IL-2 expression.
TCR-induced IL-2 production by T cells in the presence of DMSO or DMH1 at day 4 (A) and 2 (B, left graph). (B, right graph) mRNA expression for IL2 after 2 days of activation. GNB2L1 was used as endogenous control. Means ± SD of three to five independent experiments performed in duplicates are shown (* p≤0.05; ** p≤0.01; by t test). (C) Proliferation rate measured by CFSE loss in T cells after 4 days of TCR stimulation with DMSO, DMH1 alone or DMH1 supplemented with the indicated doses of rhIL-2. Bars represent the means ± SD of three independent experiments (* p≤0.05; by t test).

