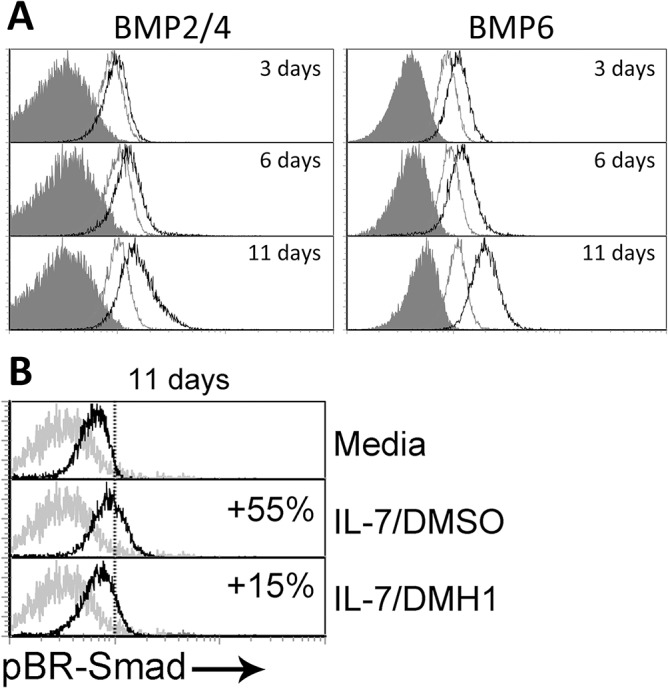
Fig 5. Canonical BMP pathway and IL-7 signaling.

(A) Expression of BMP2/4 and BMP6 was determined by flow cytometry at the indicated time points in T cells cultured in media alone (grey histograms) or in the presence of IL-7 (5 ng/ml) (black histograms). Grey filled histograms represent isotype control stainings. A representative experiment out of four is shown. (B) Differential expression of phosphorylated Smad-1/5/8 (pBR-Smad) analyzed by flow cytometry in naive CD4+ T cells after 11 days of culture in media alone or supplemented with IL-7 and DMSO or IL-7 and DMH1 (40 μM). Percentages represent the increment relative to cultures in media alone. One representative of three independent experiments is shown.
