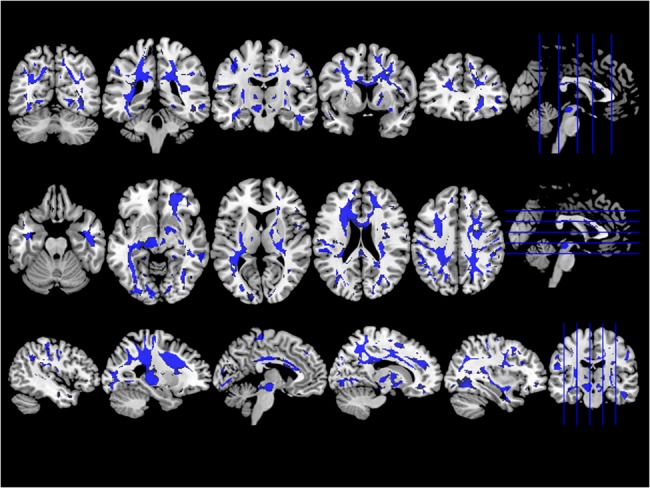
Fig 2. Group comparison of SWI images between ALS patients and healthy controls.

ALS patients showed lower SWI signal in deep white matter tracts, including corpus callosum, corticospinal and superior longitudinal fascicle most prominent in its frontal parts. The statistical parametric maps are displayed at a threshold P < 0.05 and corrected for multiple comparisons using FWE.
