
Figure 2.
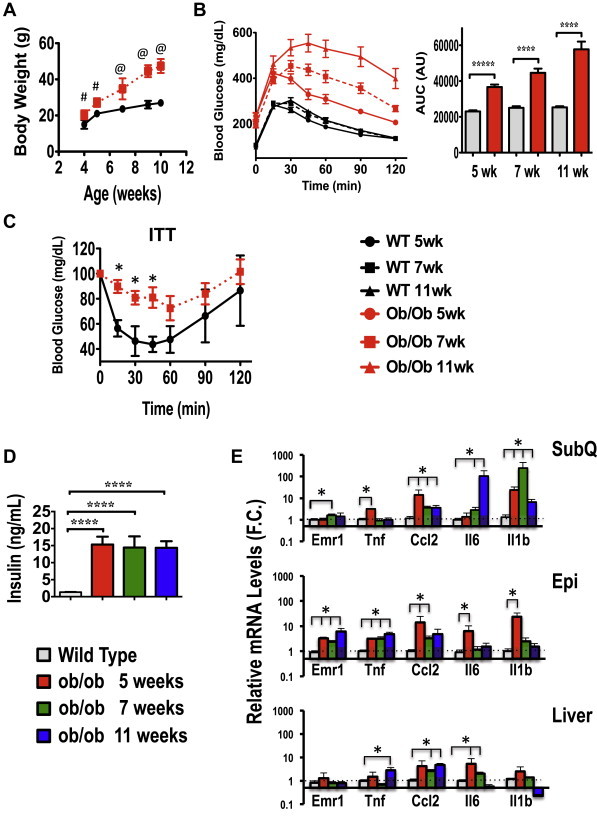
Time course of hyperinsulinemia, inflammation, glucose intolerance and insulin resistance in ob/ob mice. (A), Body weight of C57BL/6J wild type (WT) or ob/ob mice (8 per group) from 4 to 11 weeks of age. (B), Glucose tolerance test (GTT) in WT and ob/ob animals at 5, 7 and 11 wks of age. Also shown is the area under the curve for the glucose tolerance test. N = 8 at mice per time point. (C) Insulin tolerance test (ITT) in WT and ob/ob mice at 7 weeks of age. (D) Plasma insulin levels at 5, 7 and 11 weeks of age in WT and ob/ob mice. WT mice from each age group were pooled as insulin levels over the time course did not differ in WT mice. (E) Inflammatory gene expression in subcutaneous (SubQ), epididymal (Epi) AT and livers from C57BL/6J WT or littermate ob/ob mice at 5, 7 or 11 weeks of age; N = 4–5 mice per group.Data are presented as mean +/− SE and were compared to appropriate controls by Student's T-test. *; P < 0.05, ****; P < 0.0001, #; P < 0.01, @; P < 0.001.