
Figure 1.
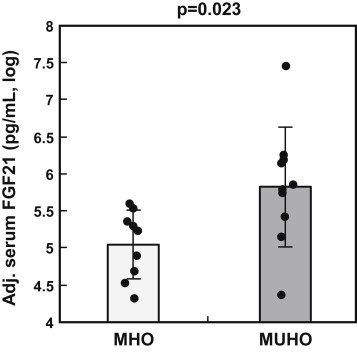
Serum FGF21 concentrations in MHO and MUHO subjects Data adjusted for gender, age, and BMI are shown as log-transformed individual data and means ± SD (N = 10 per group). Adjustment was performed by multiple linear regression modeling. MHO – metabolically healthy obesity; MUHO – metabolically unhealthy obesity.