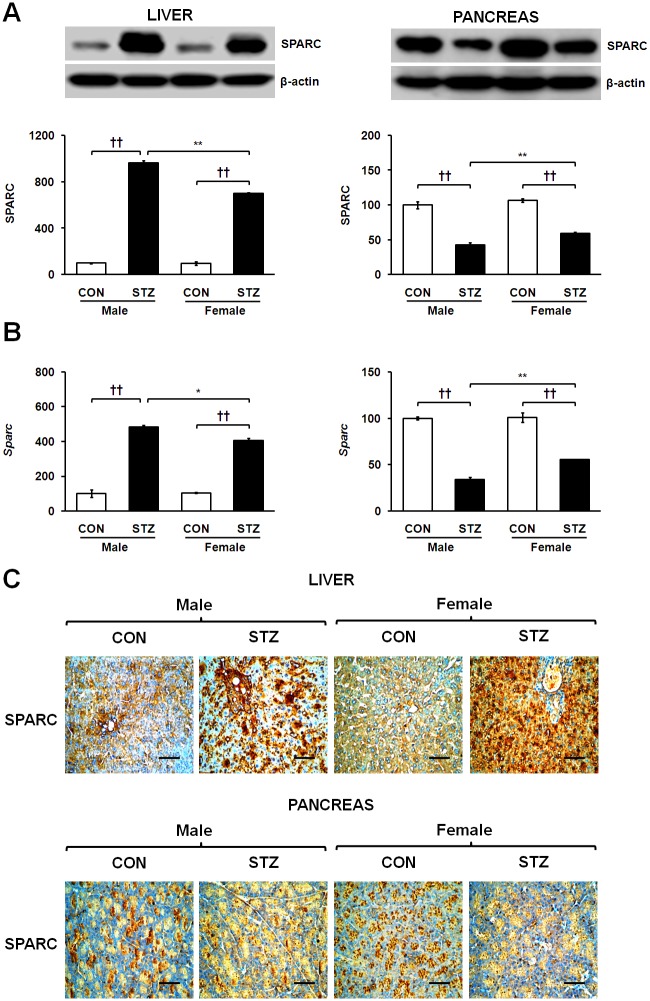
Fig 2. Tissue-dependent expression of SPARC in the liver and pancreas of males and females at protein (A) and mRNA levels (B).
Immunohistochemistry of SPARC in hepatic and pancreatic tissues of control and STZ-induced diabetic rats (C), where representative photomicrographs are shown and sections were counter-stained with haematoxylin (magnification X400 and scale bar represents 50 μm). Data are representative of three independent experiments. Statistical significance between male and female rats was calculated by One-way ANOVA followed by Tukey’s post hoc tests, where p-value is *p<0.05 and **p<0.01, and significance between controls and diabetics is represented by † p<0.05 and †† p<0.01.

