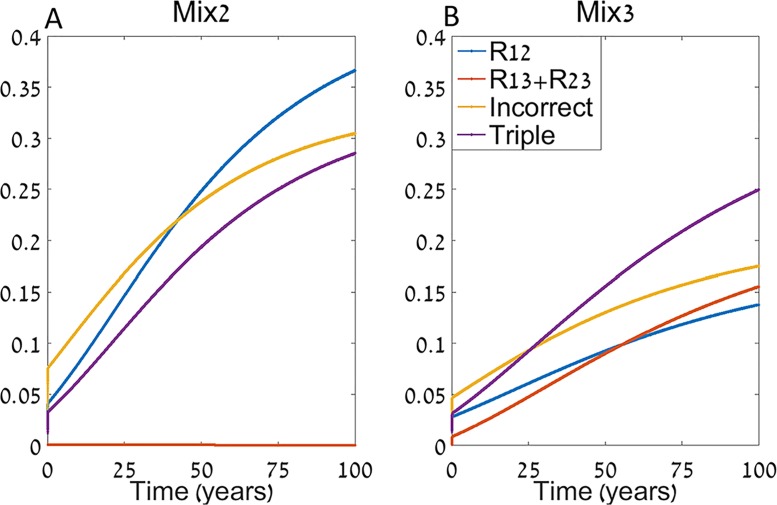
Fig 3. Time series of mix2 (A) and mix3 (B).
We plot the frequencies of double resistant infections resistant to the third antibiotic (R 1,3 + R 2,3), the double resistant infections resistant to the two commonly used antibiotics (R 1,2), the measured incorrectly treated patients, and the emergence of triple resistance. The model is simulated for an extended period of time (100 years) to capture long term effects and the rest of the parameters are as in Fig 2.

