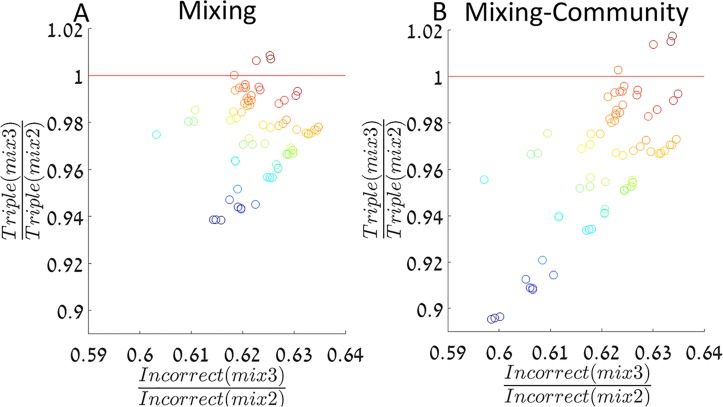
Fig 4. The mixing strategy for estimated resistance frequencies.
For each data point, its location on the X axis represents the predicted ratio of incorrect treatment under mix3 relative to mix2 according to our model, and its location on the Y axis represents the predicted ratio of triple resistance emergence. A red line is drawn where the strategies inhibit triple resistance equally well, so below the line mix3 reduces both incorrect treatment and triple resistance emergence more efficiently than mix2. Panels A and B present the results of the models without community feedback and with it, respectively. Antibiotic resistance frequencies among incoming patients are estimated from data (see Methods and S1 Table). The color indicates the estimated resistance frequencies to the common antibiotics (). The system is simulated for 20 years and the rest of the parameters are as in Fig 2.

