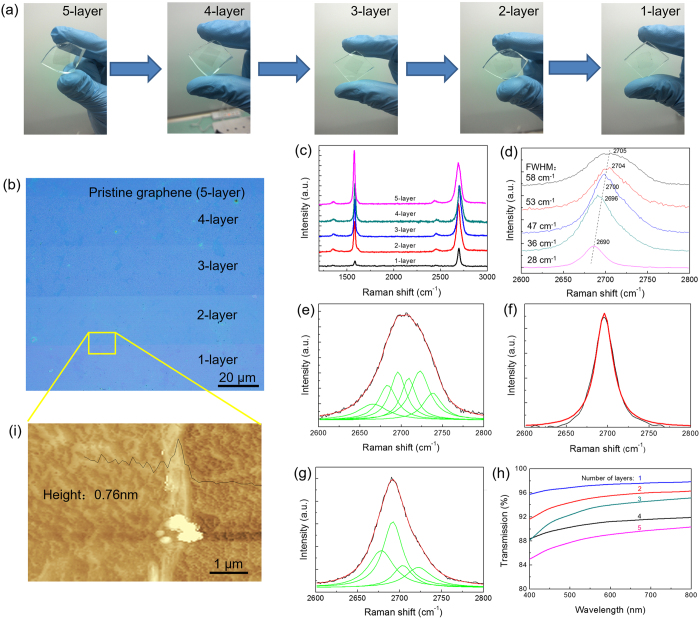
Figure 2.
(a) Photographs and (b) optical image of graphene with different NOL obtained by laser thinning. (c) Raman spectra of graphene with different numbers of layers. (d) Corresponding 2D peak position and FWHM. The splitting of 2D peak by Lorentzian fitting: (e) 5-layer, (f) monolayer and (g) bilayer graphene. (h) Transmittance spectra. (i) AFM image.

