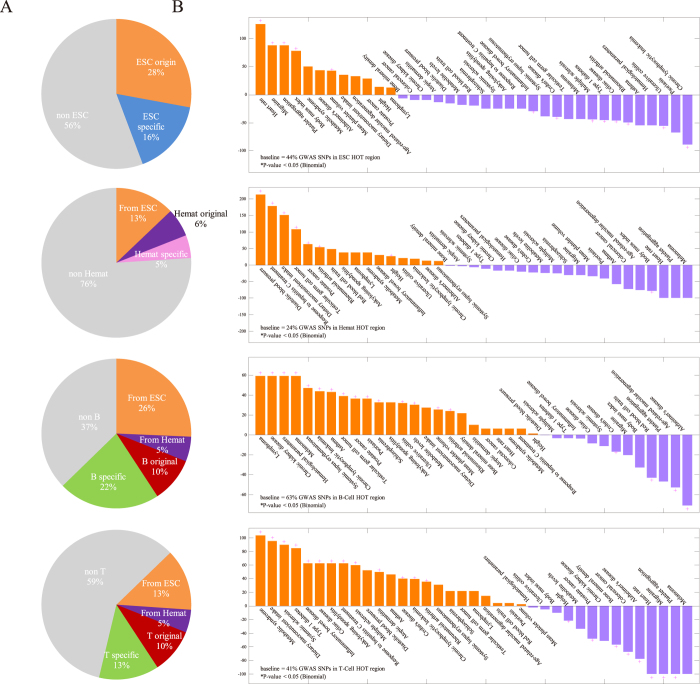
Figure 2. Enrichment of GWAS variants and phenotypes during haematopoiesis.
(A) Proportion of GWAS SNPs selectively localised in HOT regions active along the hematopoietic lineage. ESC stage-specific HOT regions (blue); hematopoietic progenitor stage-specific HOT regions (pink); lymphoid cell stage-specific HOT regions (green); ESC-originated HOT regions (salmon); hematopoietic progenitor-originated HOT regions (purple); lymphoid cell-originated HOT regions (red) and HOT regions that belong to other stages (grey). (B) GWAS SNPs in HOT regions along the hematopoietic lineage exhibit phenotype-specific enrichment for development-specific HOT regions.

