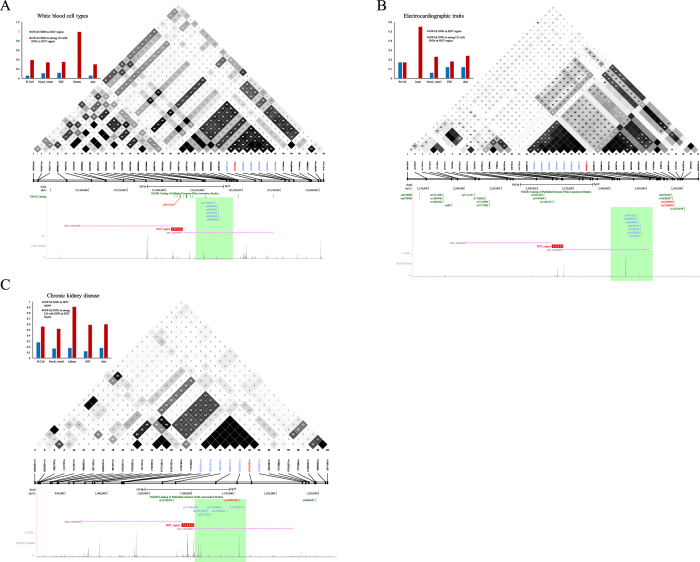
Figure 5. SNPs in strong LD with GWAS SNPs in disease-specific HOT regions.
(A) (Upper-left) Bar plots that show the density of white blood cell type (WBCT)-associated noncoding SNPs and SNPs in strong LD (r2 > 0.8) with WBCT-associated SNPs (SNP/MB) in the HOT region domains and LOT region domains identified in 5 human cell and tissue types. (Upper-right) Example of GWAS SNPs in LD with WBCT-associated noncoding SNP rs9373124 (red bar). (Bottom) Distribution of GWAS SNPs (blue bar) in strong LD (r2 > 0.8) with rs9373124. The HOT region is extended by 250 kb. (B) (Upper-left) Bar plots that show the density of electrocardiographic trait-associated noncoding SNPs and SNPs in strong LD (r2 > 0.8) with electrocardiographic trait-associated SNPs (SNP/MB) in the HOT and LOT region domains identified in 5 human cell and tissue types. (Upper-right) Example GWAS SNPs in LD with electrocardiographic trait-associated noncoding SNP rs1296050 (red bar). (Bottom) Distribution of GWAS SNPs (blue bar) in strong LD (r2 > 0.8) with rs1296050. The HOT region is extended by 250 kb. (C) (Upper-left) Bar plots that show the density of chronic kidney disease (CKD) trait-associated noncoding SNPs and SNPs in strong LD (r2 > 0.8) with CKD trait-associated SNPs (SNP/MB) in the HOT and LOT region domains identified in 5 human cell and tissue types. (Upper-right) Example of GWAS SNPs in LD with CKD trait-associated noncoding SNP rs10794720 (red bar). (Bottom) Distribution of GWAS SNPs (blue bar) in strong LD (r2 > 0.8) with rs10794720. The HOT region is extended by 250 kb.

