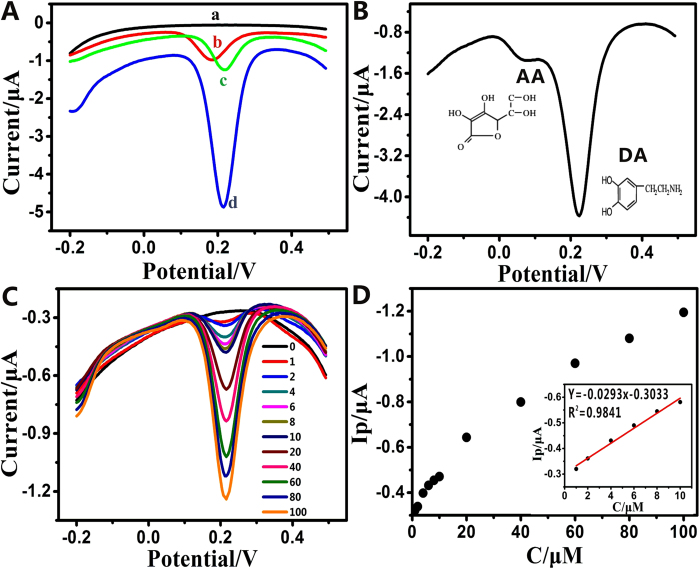
Figure 4.
(A) DPVs of different acupuncture needles in the solution of 0.1 mM DA ((a) bare acupuncture needle, (b) AuNPs/acupuncture needle, (c) ERGO/acupuncture needle and (d) G-AN). (B) DPVs of the G-AN in the solution of 0.1 mM DA and 1 mM AA. Scan rate, 50 mV/s. (C) The DPVs versus increasing DA concentrations of 0, 1, 2, 4, 6, 8, 10, 20, 40, 60, 80 and 100 μM (from top to bottom). (D) In the inset, the calibration curve of DPVs versus DA concentrations (1 to 10 μM) was represented by Ip(μA) = −0.0293C DA (μM)-0.3033, R2 = 0.9841.

