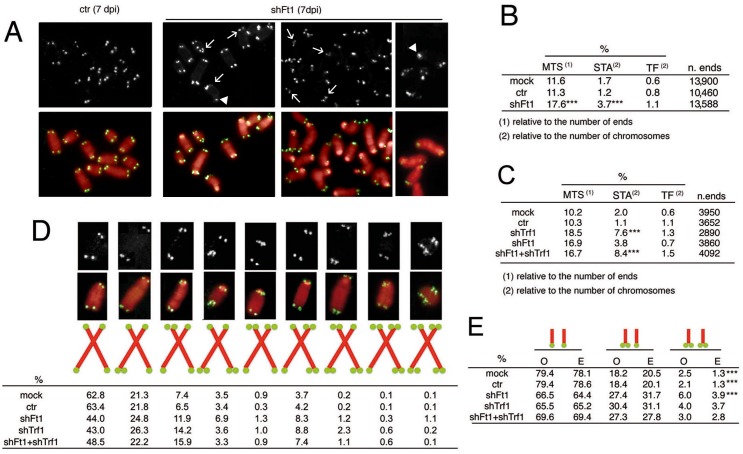
Fig 3. Ft1 downregulation leads to telomeric aberrations.
(A) Partial DAPI-stained (red) metaphases from ctr or shFt1 MEFs showing telomeric FISH signals (black and white; green in merges); arrows indicate selected multiple telomeric signals (MTSs), and arrowhead points to sister telomere associations (STAs). (B) MTS, STA and telomere fusion (TF) frequencies in mock and 7 dpi ctr and shFt1 MEFs; *** significantly different from controls in the χ2 test with p<0.001. Values are the mean frequencies from 2 independent experiments. (C) Trf1 is epistatic to Ft1. The MTS frequencies observed in shFt1, shTrf1 and shFt1 + shTrf1 are not significantly different in the χ2 test, but the STA frequencies observed in shFt1, shTrf1 and shFt1 + shTrf1 are significantly higher that that seen shFt1 (***different in the χ2 test with p<0.001). Values are the mean frequencies from 2 independent experiments. (D) Relative frequencies of the indicated chromosome types; frequencies were calculated from pooled data (B and C). (E) Observed (O) and expected (E; on the basis of independence; calculated from pooled data using the binomial distribution formula) frequencies of sister telomere pairs with the indicated FISH patterns; *** O-E differences significant with p<0.001 in the χ2 test. See also S4 and S5 Figs.

